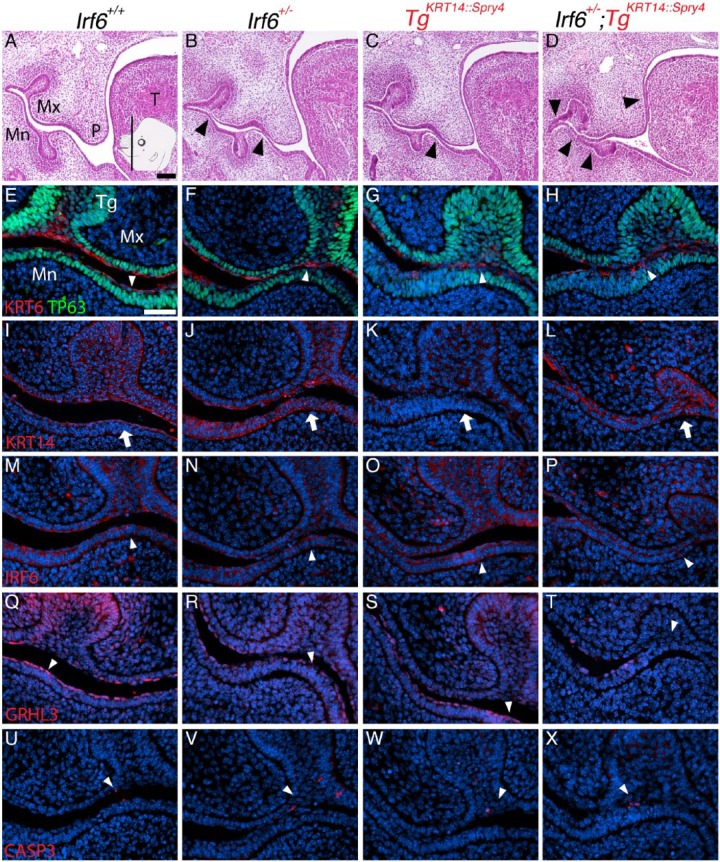
Figure 2.
Irf6 and Spry4 regulate oral epithelium development at E13.5 at the tooth germ. Insert in (A) shows plane and approximate location of sections (A–X). Images and analysis of oral epithelium using hematoxylin and eosin (H&E) staining (A–D) to identify oral adhesions and immunostaining (E–X) to examine expression of KRT6/TP63 (E–H), KRT14 (I–L), IRF6 (M–P), GRHL3 (Q–T), and activated caspase 3 (CASP3, U–X) at the tooth germ. Genotypes separated by columns, including wild-type (A, E, I, M, Q, U), Irf6 heterozygous (Irf6+/–) (B, F, J, N, R, V), TgKRT14::Spry4 (C, G, K, O, S, W), and Irf6+/–;TgKRT14::Spry4 embryos (D, H, L, P, T, X). Relative to wild-type embryos (A), Irf6 heterozygous embryos had minor oral adhesions between the mandibular epithelium and either the palatal or maxillary epithelium (B, black arrowheads). TgKRT14::Spry4 embryos appeared to have similar maxillary-mandibular oral adhesions (C, black arrowhead), but other transgenic embryos TgKRT14::Spry4 also had oral adhesions between the palate and tongue (Fig. 4). Irf6+/–;TgKRT14::Spry4 embryos had more extensive maxillary-mandibular and palatal-lingual oral adhesions (D, black arrowheads). (E, F) The morphology of periderm cells was more cuboidal than squamous in TgKRT14::Spry4 (G) and Irf6+/–;TgKRT14::Spry4 (H) embryos (white arrowheads). Immunostaining shows irregular KRT6 staining and an expanded basal layer (TP63) in TgKRT14::Spry4 (G) and Irf6+/–;TgKRT14::Spry4 (H) embryos. (I–L) KRT14 immunostaining was slightly reduced in TgKRT14::Spry4 embryos (K) but highlighted the extent and severity of oral adhesions in Irf6+/–;TgKRT14::Spry4 (L) embryos (white arrow). (M–P) IRF6 staining showed expression in epithelium (white arrowheads), including sites of oral adhesions (P). (Q–T) GRHL3 expression was detected in periderm (Q–S, white arrowheads) but not in sites of oral adhesions in Irf6+/–;TgKRT14::Spry4 embryos (T, white arrowhead). (U–X) Activated caspase 3 staining in epithelium was similar for all genotypes. Scale bars: (A–D) 250 µm; (E–X) 40 µm. Mn, mandible; Mx, maxilla, P, palate; T, tongue; Tg, tooth germ.

