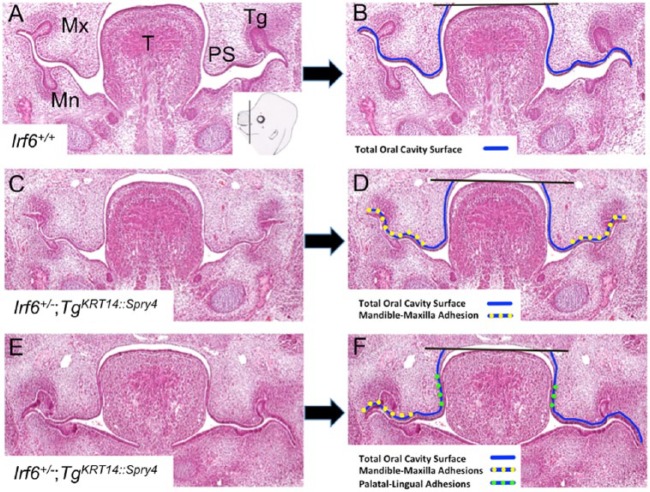
Figure 4.
Quantitative oral adhesion assay. (A–F) Coronal sections of E13.5 oral cavities. (A) Inset in right lower corner of this images shows cartoon with a black line indicating the plan of section and approximate location of sections. Two genotypes are shown to illustrate different types of oral adhesions and how they were measured: wild-type (A, B) and Irf6 heterozygous, transgenic embryos (Irf6+/–;TgKRT14::Spry4) (CF). We used standard microscope software to measure the distance around the curved surface of the oral cavity using multiple linear segments (arc length). Representative images and lines before (left column: A, C, E) and after (right column: B, D, F) surface measurements indicated with colored lines. We measured oral epithelium from the lateral edges of the oral cavity to the top of the tongue (black horizontal line bisecting oral epithelium) (B, D, F). We obtained the arc length for the whole oral cavity (blue line), maxilla-mandible oral adhesion (yellow-dotted line), and palatal-lingual oral adhesions (green-dotted line) (B, D, F). Mn, mandible; Mx, maxilla; PS, palatal shelf; T, tongue; Tg, tooth germ.

