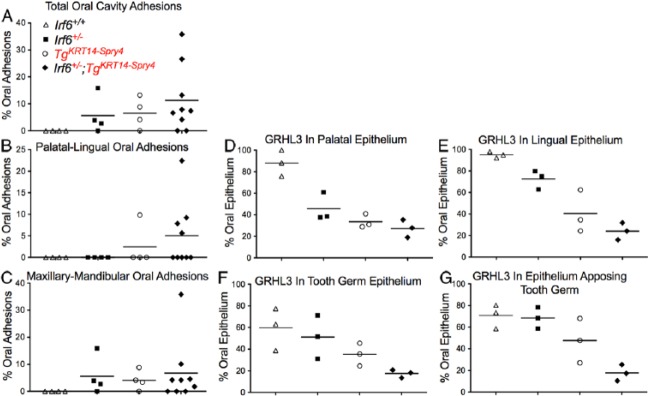
Figure 5.
A quantitative adhesion assay shows that Irf6+/–;TgKRT14::Spry4 embryos have more extensive oral adhesions at E13.5. (A–C) We obtained a percent arc length of total oral adhesion, relative to the entire arc length of the oral cavity (A). We then calculated the individual contributions of palatal-lingual (B) and maxillary-mandibular (C) oral adhesions as a percentage of the total arc length. (D–G) Quantifying percent oral epithelium expressing GRHL3. We calculated the percent oral epithelium where GRHL3 was detected on each epithelial surface (D–G) for both palatal-lingual (D, E) and maxillary-mandibular (F, G) oral adhesions. The y-axis shows the percent epithelium where GRHL3 was detected. Three images were quantified for each epithelial surface and each genotype using the arc length tool in NIS Elements Advanced Research v3.10. Four genotypes were tested, including wild-type (white triangle), Irf6 heterozygous (Irf6+/–) (black square), TgKRT14::Spry4 (white circle), and Irf6+/–;TgKRT14::Spry4 (black diamond) embryos.

