Abstract
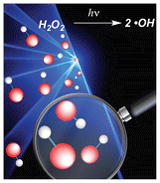
Fast photochemical oxidation of proteins (FPOP) employs laser photolysis of hydrogen peroxide to give OH radicals that label amino acid side-chains of proteins on the microsecond time scale. A method for quantitation of hydroxyl radicals after laser photolysis is of importance to FPOP because it establishes a means to adjust the yield of •OH, offers the opportunity of tunable modifications, and provides a basis for kinetic measurements. The initial concentration of OH radicals has yet to be measured experimentally. We report here an approach using isotope dilution gas chromatography/mass spectrometry (GC/MS) to determine quantitatively the initial •OH concentration (we found ~ 0.95 mM from 15 mM H2O2) from laser photolysis and to investigate the quenching efficiencies for various •OH scavengers.
Keywords: FPOP, Dosimetry, Isotope Dilution, Gas Chromatography/Mass Spectrometry
Graphical Abstract

INTRODUCTION
Protein footprinting examines protein structure and conformational changes by monitoring solvent accessibility and/or H-bonding by using either modification or cleavage reactions [1]. The marriage of mass spectrometry (MS) proteomics methods and protein footprinting allows protein structure, function, dynamics, interactions with ligands and stoichiometry to be examined [2]. Hydroxyl-radical oxidation is one method of “protein footprinting”, a term coined by Chance [3] for synchrotron-induced labeling. Hettich and Sharp [4] had earlier explored slow labeling via Fenton chemistry. Although there are other ways to produce •OH [5–7], the “fast photochemical oxidation of proteins” (FPOP) method shares the advantages that a stable, irreversible covalent modification is installed in nearly 3/4th of the amino-acid residues, providing higher coverage than most labeling methods. Given that •OH is comparable in size to a water molecule, FPOP is a probe of solvent accessibility. Moreover, FPOP provides a fast “snapshot” of protein structure (~ 1 s) without concern for rearrangements or loss of label during subsequent sample handling and proteolysis, and it can accommodate other radical reagents [8,9].
FPOP utilizes a pulsed laser to photolyze hydrogen peroxide to generate two •OH that rapidly modify proteins in a flow system [10]. The laser provides a spatially small, high flux of light, maximizing the exposure of small plugs of protein solution to radicals and ensuring all but a small fraction of the protein in the flow is irradiated only once [11]. FPOP is a practical approach, requiring only a modest laser and syringe pump [12–14].
Missing thus far in the development of FPOP is a method that gives the initial concentration of •OH, allowing rational means for tuning. The concentration of •OH is also an input to any kinetic analysis to control the approach. Quantitation of •OH generated in FPOP is difficult because the radicals are short-lived. Hambly et al. [10] estimated the initial concentration of •OH to be 1 mM, consistent with the molar absorptivity of H2O2 and the quantum yield of •OH. Chen, using LC/MS, measured preliminarily the [•OH] to be 0.42 mM [15]. The high speed of oxidative modifications in FPOP, however, can be placed on a firmer ground by measuring the initial [•OH] with a routine method.
Here we report a determination of the initial concentration of •OH upon laser photolysis by using isotope dilution GC/MS, which is sensitive, specific [16,17], and gives good accuracy, precision, and correction for analyte loss during handling [18]. We selected unlabeled phenylalanine as a “dosimeter molecule” to quantify the •OH and d5-phenylalanine as the internal standard. Phenylalanine is suitable because it is reactive towards •OH (rate constant of 6.9 × 10⁹ M−1s−1 [19]), and it yields simple oxidation products by a mechanism discussed elsewhere [1].
We measured the initial •OH concentration in FPOP and found that it is comparable to our previous estimate [10]. Further, we measured [•OH] available to label proteins as a function of both the nature and concentration of the scavenger (i.e., methionine, histidine and glutamine).
EXPERIMENTAL SECTION
Materials and Reagents
Unlabeled phenylalanine and d5-phenylalanine were provided by Jan Crowley. L-Glutamine, L-methionine, L-histidine, catalase, 30% hydrogen peroxide, N,O-bis(trimethylsilyl)fluoroacetamide (BSTFA), phosphate-buffer saline (PBS) and HPLC-grade solvents were from Sigma Aldrich (St. Louis, MO)
Calibration
A series of solutions containing increasing amounts of d0-phenylalanine (0, 10, 25, 50, 100 nmol) were dissolved in PBS buffer (10 mM phosphate buffer, 138 mM NaCl, and 2.7 mM KCl, pH 7.4), mixed with H2O2, and submitted to FPOP without pulsing the laser to correct for any analyte losses. Methionine and catalase were added to each vial immediately following to simulate FPOP conditions. A constant amount of d5-phenylalanine internal standard (100 nmol) was then added to each vial.
After removing the solvent by speed-vac, the samples were treated with BSTFA to form trimethylsilyl derivatives that were analyzed by GC/high resolution MS with extracted ion chromatography and integration of ion peaks for the standard and unknown to give an intensity ratio of the analyte and the internal standard. The ratio was plotted as a function of the amount of d0-phenylalanine initially added.
FPOP Dosimetry Experiment
Our goal was to determine the yield of •OH when there was no scavenger in the system (Scheme 1) by incorporating the laser pulse for FPOP, as described previously [10]. d0-Phenylalanine (100 nmol) as dosimeter was dissolved in PBS buffer, and H2O2 peroxide was added just prior to syringe infusion; their concentrations were 2 and 15 mM, respectively. The sample solution was advanced at a rate of 23 μL/min by a syringe pump (Harvard Apparatus, Holliston, MA),
Scheme 1.

(1) Without scavenger, 100 nmol of dosimeter (d0-phenylalanine) was subjected to FPOP, generating tyrosine-like products from •OH attack on the aromatic ring. (2) Internal standard (d5-phenylalanine) added to vial. (3) BSTFA added for derivatization of both dosimeter and internal standard. (4) Products analyzed by GC/MS.
The excimer laser power (GAM Laser Inc, Orlando, FL) at 248 nm was adjusted to ~40 mJ/pulse at a frequency of 7.0 Hz, affording an exclusion volume fraction of 20% (the volume not irradiated by laser, sandwiched between plugs of irradiated solution). All collections were in vials containing 500 nM catalase and 70 mM methionine, preventing further oxidation by H2O2. A solution containing 100 nmol of d5-phenylalanine was added to each vial, the solution dried on a speed vac, derivatized with BSTFA, and analyzed by GC/MS to give the amount of d0-phenylalanine reacted which equals the amount of •OH generated.
Gas Chromatography/Mass Spectrometry
Samples were diluted 10:1 before injecting into an Agilent 7200 Q-TOF GC/MS (Santa Clara, CA) with a split of 10:1, to avoid column overload and detector saturation. The inlet temperature was 280 °C. The gas chromatograph was an Agilent 7890 equipped with an Agilent 19091S HP-5ms column (30 m, 0.25 mm id., 0.25 μm 5% diphenyl 95% dimethylpolysiloxane film coating). The GC oven temperature was at 80 °C for 2 min after sample auto-injection and then ramped at a rate of 10 oC/min to a final temperature of 300 °C, which was held for 6 min. All spectra were acquired in the positive-ion EI mode.
RESULTS AND DISCUSSION
To measure the [•OH], we derivatized the carboxyl and amine groups of phenylalanine with trimethylsilyl groups, taking advantage of this well-known protocol [20]. We chose fragment ions of m/z 294.1340 and 299.1654 (derivatized d0-phenylalanine and d5-phenylalanine) because the molecular ions (M+•) of m/z 309.1575 and 314.1889 were not detectable [21] (structures and EI mass spectra are in SI). Other appropriate fragment ions are of m/z 266.1391 and 271.1705; and of m/z 91.0542 and 96.0856.
To conduct the analysis, we held constant the amount of d5-phenylalanine derivative in each sample (100 nmol), so there was little change in its ion-current peak integral (see SI Figure 2), and increased d0-phenylalanine from 0 to 100 nmol. The ratio of the ion-current peak integrals (d0/d5) was obtained from extracted ion chromatograms and plotted as a function of amount of added d0-phenylalanine. The ions of m/z 294.1340 and 299.1654 gave a ratio of peak integrals (d0/d5) as a linear function of the amount of d0-phenylalanine over 0–100 nmol (see SI Figure 3). The curve (slope of 0.0061, y-axis intercept of 0.015, and an R2 of 0.9970) provided the interpolated concentration of remaining d0-phenylalanine. By subtracting this amount of d0-phenylalanine from the initial amount, we obtained the amount of consumed d0-phenylalanine, which is the amount of •OH from each laser pulse that reacted with the dosimeter. From these experiments, the •OH concentration that reacted with the dosimeter from each laser pulse was 0.67 ± 0.08 mM from a starting solution of 15 mM H2O2, an amount close to our earlier estimate [10].
We selected two other fragment-ion pairs (m/z 266.1391 and 271.1705; and m/z 91.0542 and 96.0856) to build two other calibrations (see SI Figure 3) that afforded measured [•OH] of 0.69 ± 0.12 and 0.68 ± 0.12 mM, respectively. Two control experiments were included, one without laser and the other without H2O2.
The initial [•OH] should be slightly higher because the measured value is reduced by •OH self-recombination, which competes with the reaction of •OH and dosimeter. We simulated by kinetic modeling the amount of phenylalanine product to predict an initial [•OH]. A search varied the postulated initial [•OH] until the calculated •OH concentration that reacted with the dosimeter matched the experimentally determined value (0.67 mM). The best fit showed the initial [•OH] to be 0.95 mM. The simulations also included the Haber-Weiss chain reaction, which has little effect. We did not model, however, any reaction of •OOH produced in the final step of phenylalanine modification [1].
Effect of Scavenger
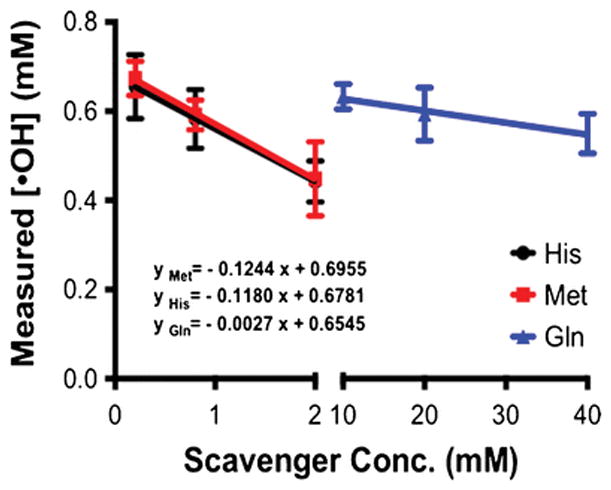
In a typical FPOP experiment, scavengers limit the available [•OH] for footprinting. Thus, it is of interest to measure the [•OH] when using scavengers of different nature or concentrations, facilitating creation of an improved FPOP platform with scavenger-tunable [•OH]. Tuning the [•OH] is important because different proteins usually require different [•OH] to achieve modifications that are sufficient to reveal structural information, yet do not give overoxidation. Moreover, varying the scavenger provides the means for measuring the kinetics of radical modification reactions. To test this, we used different concentrations of glutamine (10, 20, 40 mM) as scavenger and measured [•OH] to establish a relationship between measured [•OH] and scavenger concentration. Furthermore, histidine and methionine were also tested as a function of concentration (0.2, 0.8, 2.0 mM) (Figure 1). For each scavenger (His, Met, Gln), the measured [•OH] decreases as scavenger concentration increases. Moreover, extrapolation of the curves to the y-axis, gives approximately the same intercept, [•OH] with no scavenger (i.e., 0.67 mM) (see Figure 1 and SI Figure 4). The equation for each scavenger response curve is also given in those figures. The ratios of the rate constants of glutamine, histidine and methionine towards •OH (5.4×10⁸ M−1s−1, 4.8×10⁹ M−1s−1, and 8.5×10⁹ M−1s−1 respectively [1]) should predict the ratios of the line slopes, and this is approximately correct. Discrepancies may be due to differences in our methods and conditions compared to the original kinetic studies.
Figure 1.

Dose-response curves determined from fragment ions of m/z 294.1340 and 299.1654 for Met, His and Gln. See SI for dose-response curves determined from other fragment ions (i.e., m/z 266.1391 and 271.1705; and m/z 91.0542 and 96.0856). Note that the lifetime of the radicals is ~ 1 s when glutamine is 20 mM—see Fig. 1.
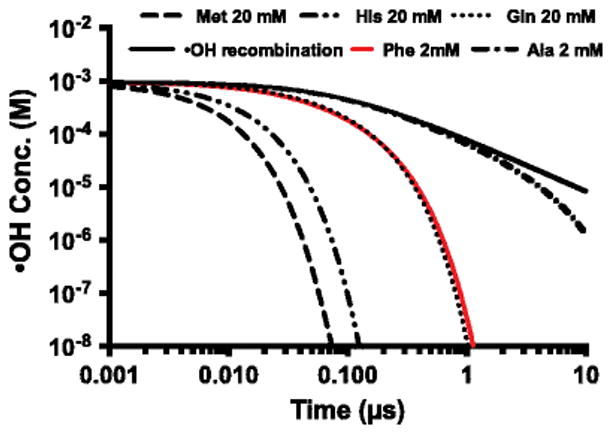
For different amino-acid scavengers, the rate constants differ by three orders of magnitude [1]. Taking advantage of this, we can adjust the [•OH] available for footprinting by varying either the nature or concentration of the scavenger. The outcomes may be significant because the time range available to FPOP can be shifted from either ~1 μs to ~100 ns (scavengers of higher reactivity or concentration), or to near ms (scavengers of lower reactivity or concentration). A numerical simulation of [•OH] by using different scavengers (Figure 2) shows that the lifetime is approximately 1 μs when using 20 mM glutamine as scavenger but adjustable to ~0.1 s by using methionine or histidine or to 100 s with alanine as scavengers (we assign the lifetime of the radicals to the time at which their concentration is 100 times less than that of the protein). Adjusting the lifetime of •OH enables labeling over a wider time scale, making FPOP a flexible tool to investigate various folding/unfolding events. For example, some proteins fold to a native state by first forming secondary and then tertiary structure [22], whereas other proteins go through hydrophobic collapse and then form tertiary structure [23]. The time-course changes for FPOP are in the time range for the major steps of protein folding, allowing future studies on its details.
Figure 2.

Numerical simulation of •OH concentration vs. time. The simulation includes the •OH reaction with scavengers, the recombination of •OH, and the Haber-Weiss chain reaction. Lifetime of •OH (~100 ns to more than 10 μs) depends on the nature and concentration of the scavenger.
CONCLUSION
The specificity, sensitivity, and precision of isotope dilution GC/MS to identify and quantify the dosimeter recommend it for quantifying the initial •OH concentration in FPOP. The approach permits optimization of FPOP conditions and adjustment of experimental parameters to realize tunable extents of modifications. Our next step is to study the effect of tuning, aiming for secure “hard” kinetic data that will allow comparison of results and lab-to-lab.
Supplementary Material
Acknowledgments
This research was supported by National Institute of General Medical Sciences (8 P41 GM103422-35 and 1R01GM108785) of the National Institute of Health. The authors thank Jan R. Crowley and Kwasi Mawuenyega for their generous advice and help.
References
- 1.Xu G, Chance MR. Hydroxyl radical-mediated modification of proteins as probes for structural proteomics. Chemical reviews. 2007;107(8):3514–3543. doi: 10.1021/cr0682047. [DOI] [PubMed] [Google Scholar]
- 2.Aebersold R, Mann M. Mass spectrometry-based proteomics. Nature. 2003;422(6928):198–207. doi: 10.1038/nature01511. [DOI] [PubMed] [Google Scholar]
- 3.Maleknia SD, Brenowitz M, Chance MR. Millisecond radiolytic modification of peptides by synchrotron X-rays identified by mass spectrometry. Analytical chemistry. 1999;71(18):3965–3973. doi: 10.1021/ac990500e. [DOI] [PubMed] [Google Scholar]
- 4.Sharp JS, Becker JM, Hettich RL. Protein surface mapping by chemical oxidation: structural analysis by mass spectrometry. Analytical biochemistry. 2003;313(2):216–225. doi: 10.1016/s0003-2697(02)00612-7. [DOI] [PubMed] [Google Scholar]
- 5.Xu G, Chance MR. Radiolytic modification of acidic amino acid residues in peptides: probes for examining protein-protein interactions. Analytical chemistry. 2004;76(5):1213–1221. doi: 10.1021/ac035422g. [DOI] [PubMed] [Google Scholar]
- 6.Sharp JS, Becker JM, Hettich RL. Analysis of protein solvent accessible surfaces by photochemical oxidation and mass spectrometry. Analytical chemistry. 2004;76(3):672–683. doi: 10.1021/ac0302004. [DOI] [PubMed] [Google Scholar]
- 7.Fenton HJH. Oxidation of Tartaric Acid in Presence of Iron. J Chem Soc. 1894;65:899–910. [Google Scholar]
- 8.Gau BC, Chen H, Zhang Y, Gross ML. Sulfate radical anion as a new reagent for fast photochemical oxidation of proteins. Analytical chemistry. 2010;82(18):7821–7827. doi: 10.1021/ac101760y. [DOI] [PMC free article] [PubMed] [Google Scholar]
- 9.Chen J, Cui W, Giblin D, Gross ML. New protein footprinting: fast photochemical iodination combined with top-down and bottom-up mass spectrometry. Journal of the American Society for Mass Spectrometry. 2012;23(8):1306–1318. doi: 10.1007/s13361-012-0403-1. [DOI] [PMC free article] [PubMed] [Google Scholar]
- 10.Hambly DM, Gross ML. Laser flash photolysis of hydrogen peroxide to oxidize protein solvent-accessible residues on the microsecond timescale. Journal of the American Society for Mass Spectrometry. 2005;16(12):2057–2063. doi: 10.1016/j.jasms.2005.09.008. [DOI] [PubMed] [Google Scholar]
- 11.Gau BC, Sharp JS, Rempel DL, Gross ML. Fast photochemical oxidation of protein footprints faster than protein unfolding. Analytical chemistry. 2009;81(16):6563–6571. doi: 10.1021/ac901054w. [DOI] [PMC free article] [PubMed] [Google Scholar]
- 12.Zhang H, Gau BC, Jones LM, Vidavsky I, Gross ML. Fast photochemical oxidation of proteins for comparing structures of protein-ligand complexes: the calmodulin-peptide model system. Analytical chemistry. 2011;83(1):311–318. doi: 10.1021/ac102426d. [DOI] [PMC free article] [PubMed] [Google Scholar]
- 13.Jones LM, JBS, JAC, Gross ML. Fast photochemical oxidation of proteins for epitope mapping. Analytical chemistry. 2011;83(20):7657–7661. doi: 10.1021/ac2007366. [DOI] [PMC free article] [PubMed] [Google Scholar]
- 14.Chen J, Rempel DL, Gau BC, Gross ML. Fast photochemical oxidation of proteins and mass spectrometry follow submillisecond protein folding at the amino-acid level. Journal of the American Chemical Society. 2012;134(45):18724–18731. doi: 10.1021/ja307606f. [DOI] [PMC free article] [PubMed] [Google Scholar]
- 15.Chen J. Doctoral thesis. Washington University; St. Louis: Dec, 2011. Mass Spectrometry for Determination of Conformation and Dynamics of Proteins and Structure and Biosynthesis of Bacterial Peptidoglycan. [Google Scholar]
- 16.Pomerantz SC, McCloskey JA. Analysis of RNA hydrolyzates by liquid chromatography-mass spectrometry. Methods in enzymology. 1990;193:796–824. doi: 10.1016/0076-6879(90)93452-q. [DOI] [PubMed] [Google Scholar]
- 17.Heinecke JW, Hsu FF, Crowley JR, Hazen SL, Leeuwenburgh C, Mueller DM, Rasmussen JE, Turk J. Detecting oxidative modification of biomolecules with isotope dilution mass spectrometry: sensitive and quantitative assays for oxidized amino acids in proteins and tissues. Methods in enzymology. 1999;300:124–144. doi: 10.1016/s0076-6879(99)00121-4. [DOI] [PubMed] [Google Scholar]
- 18.Chapman JR. A Wiley-Interscience publication. Wiley; Chichester West Sussex ; New York: 1985. Practical organic mass spectrometry. [Google Scholar]
- 19.Masuda T, Nakano S, Kondo M. Rate constants for the reactions of OH radicals with the enzyme proteins as determined by the p-nitrosodimethylaniline method. Journal of radiation research. 1973;14(4):339–345. doi: 10.1269/jrr.14.339. [DOI] [PubMed] [Google Scholar]
- 20.Crowley JR, Yarasheski K, Leeuwenburgh C, Turk J, Heinecke JW. Isotope dilution mass spectrometric quantification of 3-nitrotyrosine in proteins and tissues is facilitated by reduction to 3-aminotyrosine. Analytical biochemistry. 1998;259(1):127–135. doi: 10.1006/abio.1998.2635. [DOI] [PubMed] [Google Scholar]
- 21.Watson JT, Sparkman OD. Introduction to mass spectrometry : instrumentation, applications and strategies for data interpretation. 4. John Wiley & Sons; Chichester, England ; Hoboken, NJ: 2007. [Google Scholar]
- 22.Gilmanshin R, Williams S, Callender RH, Woodruff WH, Dyer RB. Fast events in protein folding: relaxation dynamics and structure of the I form of apomyoglobin. Biochemistry. 1997;36(48):15006–15012. doi: 10.1021/bi970634r. [DOI] [PubMed] [Google Scholar]
- 23.Arai M, Kondrashkina E, Kayatekin C, Matthews CR, Iwakura M, Bilsel O. Microsecond hydrophobic collapse in the folding of Escherichia coli dihydrofolate reductase, an alpha/beta-type protein. Journal of molecular biology. 2007;368(1):219–229. doi: 10.1016/j.jmb.2007.01.085. [DOI] [PubMed] [Google Scholar]
Associated Data
This section collects any data citations, data availability statements, or supplementary materials included in this article.


