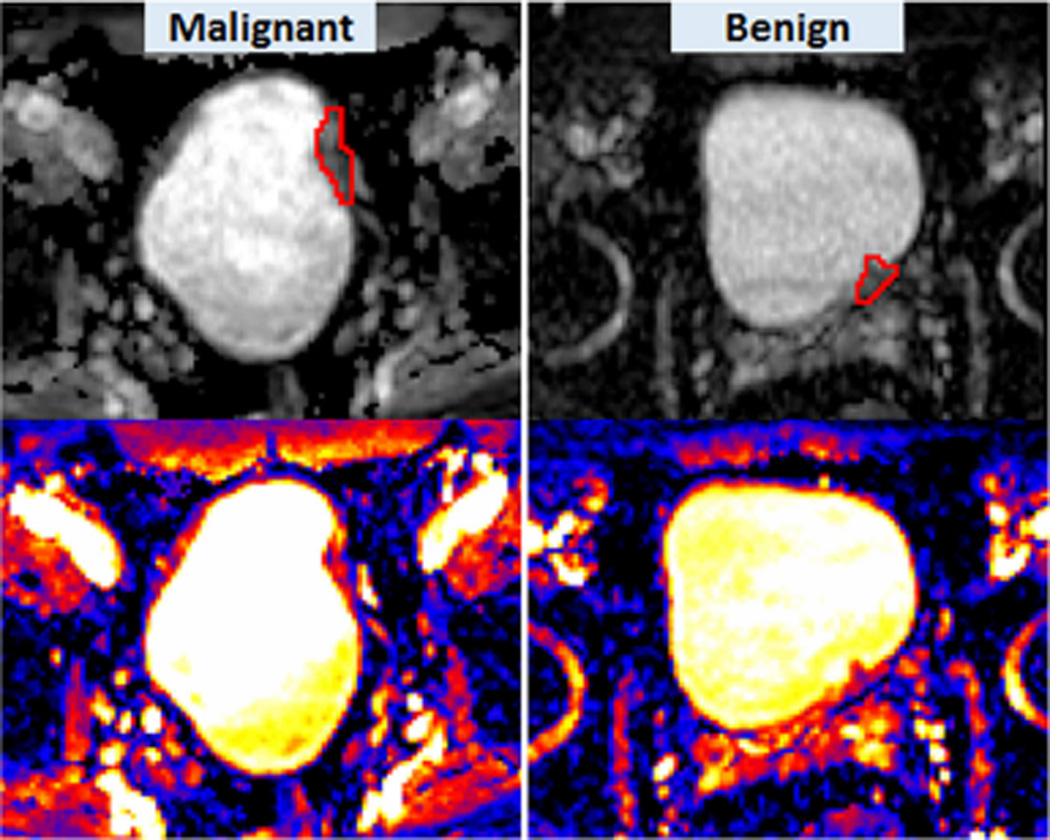
Fig. 4.
ADC heterogeneity in a malignancy (left) vs. a benign lesion (right). Shown here are grey-scaled ADC maps in the upper row, colour-coded ADC maps in the lower row. Red contours illustrate the ROIs placed on the lesions. Malignant: U = 0.062; E = 4.25; MICD = 159.4(× 10−9 mm2/s); LICD = 986.5 (× 10−9 mm2/s). Benign: U = 0.088; E = 3.72; MICD = 112.3 (× 10−9 mm2/s); LICD = 664.5 (× 10−9 mm2/s)

