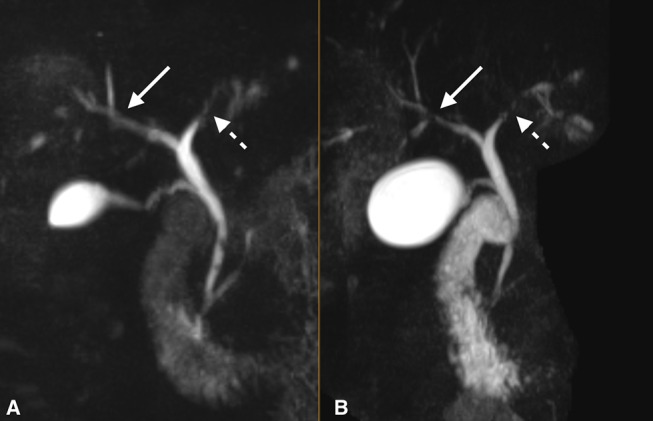
Figure 1.

T2-weighted three-dimensional maximum intensity projection coronal images with fat saturation from prior to treatment induction (B) and 13 months following induction (A) demonstrate improvement in the strictures of the intrahepatic biliary tree, particularly the right hepatic duct and its segmental branches (solid arrows). The left hepatic duct also shows decreased irregular luminal narrowing (dashed arrows) following vedolizumab therapy. Both images are shown at equal levels as they are centred at the hepatic hilum with.
