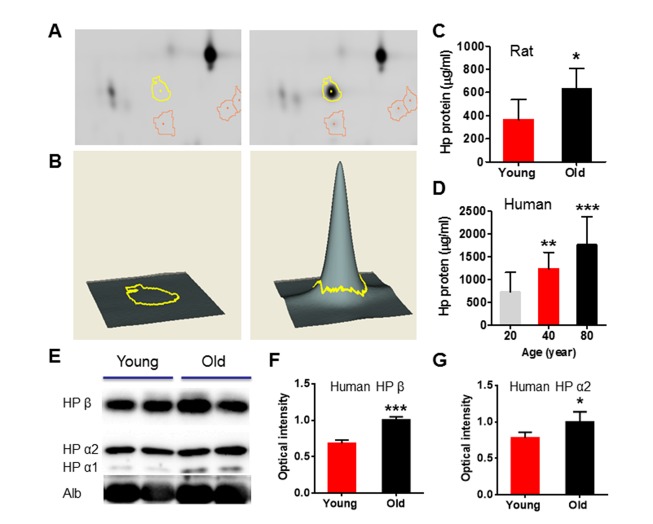
Figure 5. Circulation level of haptoglobin is significantly increased in both old rat and human plasma.
(A) DeCyder Analysis shows the location of a 2D-DIGE gel with yellow line pointing to protein spots, identified as haptoglobin, that was differentially expressed across age, >72.5 change in abundance. (B) 3-D view simulation of a close-up of the region of 2D-DIGE gel image, and the associated graph of representative up-regulated haptoglobin during aging. (C) ELISA shows that haptoglobin was increased in young and old rat plasma. N=7 rats per group. (D) ELISA shows that haptoglobin concentration in the plasma of 20-, 40-, and 80-years-old human subjects. (E) Western blot analysis confirms that increased level of haptoglobin α1, α2 and β in old human plasma. (F and G) Relative optical intensity of haptoglobin β and α2. Data were from 10 per group. Values were presented as mean ± SEM. *P < 0.05, **P < 0.01, ***P < 0.001.

