Figure 8.

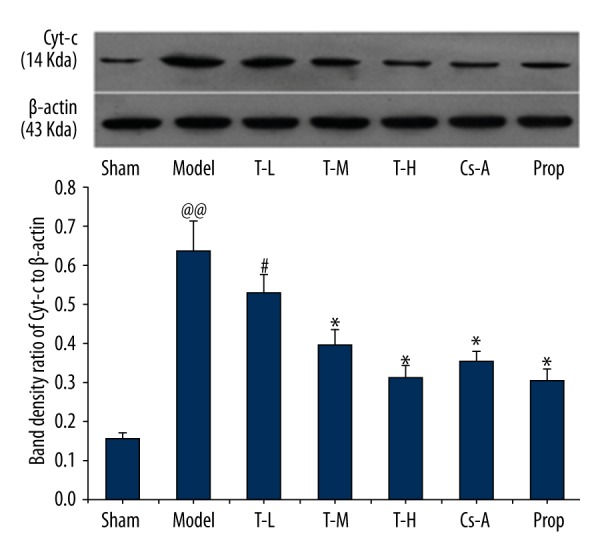
Effect of tilianin on the cytochrome c in the cytoplasm. All data are expressed as mean ±SD, n=6. Compared with the Sham group, @@ p<0.01; Compared with the Model group, * p<0.05, ** p<0.01; Compared with Cs-A group, # p<0.05.

Effect of tilianin on the cytochrome c in the cytoplasm. All data are expressed as mean ±SD, n=6. Compared with the Sham group, @@ p<0.01; Compared with the Model group, * p<0.05, ** p<0.01; Compared with Cs-A group, # p<0.05.