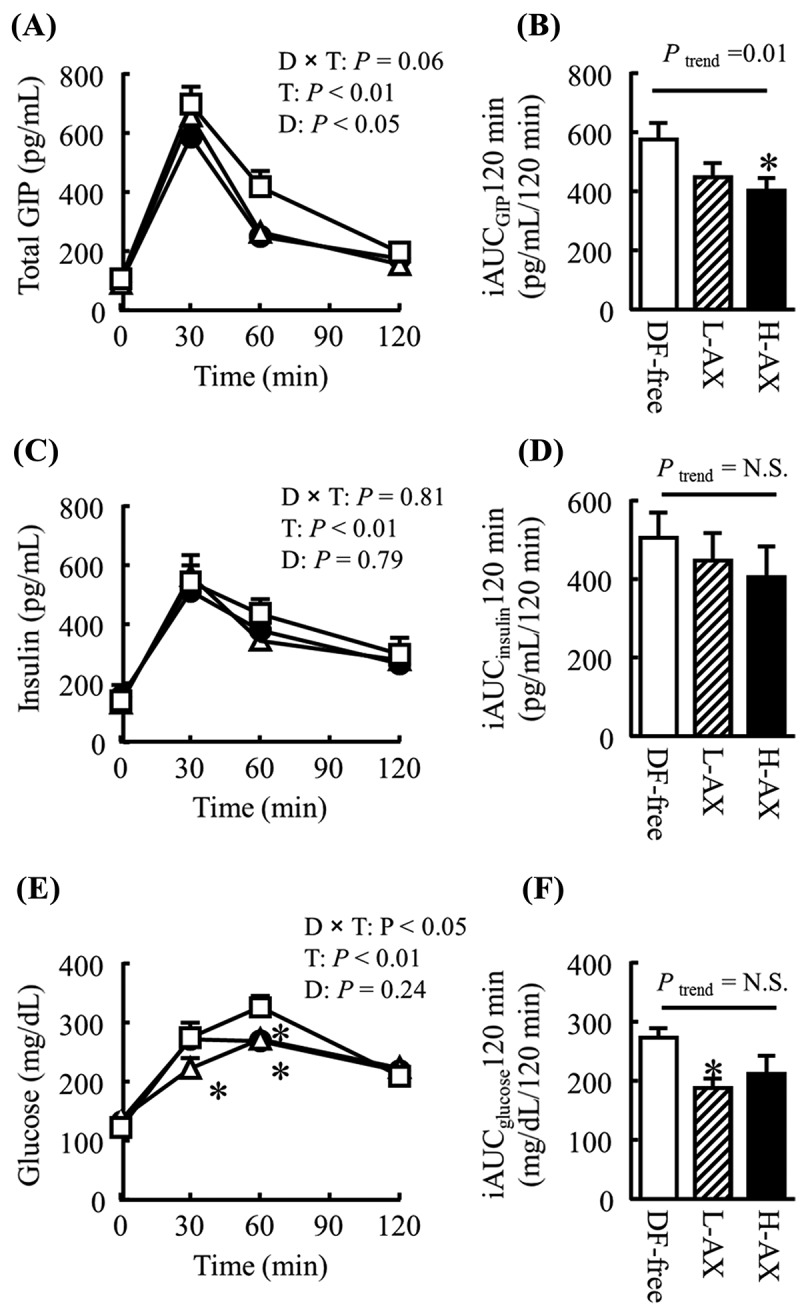
Figure 3.

Effects of arabinoxylan on postprandial blood variables. The graphs show the plasma concentrations at the indicated times after feeding (A, C, and E) and the incremental area under the curve (iAUC; B, D, and E) of (A, B) total glucose-dependent insulinotropic polypeptide (GIP), (C, D) insulin, and (E, F) glucose in mice fed the dietary fiber-free diet (DF-free; open squares), the low-dose arabinoxylan diet (L-AX; open triangles), or the high-dose arabinoxylan diet (H-AX; closed circles). All data are presented as mean ± SE (n = 8 per group). The incremental areas under the curve (iAUCs) of (B) total GIP, (D) insulin, and (F) glucose of the mice fed each of the diets were evaluated using the Bonferroni post hoc test (vs DF-free) after one-way ANOVA. Dose dependency was evaluated using the Jonckheere trend test (Ptrend). Time-dependent changes were compared using two-way ANOVA to evaluate the diet-by-time interaction (D × T), the time effect (T), and the diet effect (D). Intergroup comparison at each time-point during the analytical period was conducted with Student’s t test. N.S., not significant, *p < 0.05 vs DF-free group.
