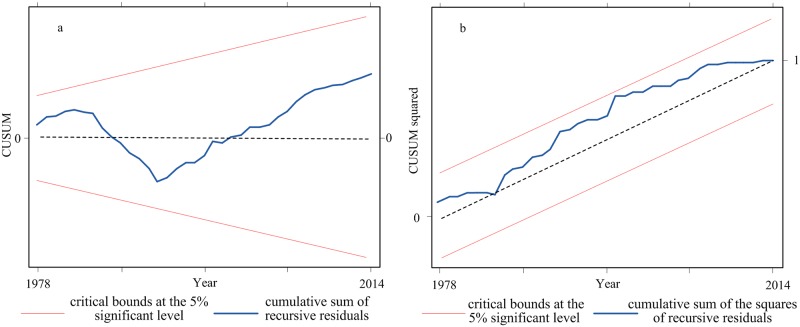
Fig 6. (a) Plot of the cumulative sum of the recursive residuals; (b) Plot of the cumulative sum of squares of the recursive residuals.
The straight red lines represent the critical bounds at the 5% significant level. The blue lines show the statistics for the cumulative sum of the recursive residuals and the cumulative sum of the squares of the recursive residuals.

