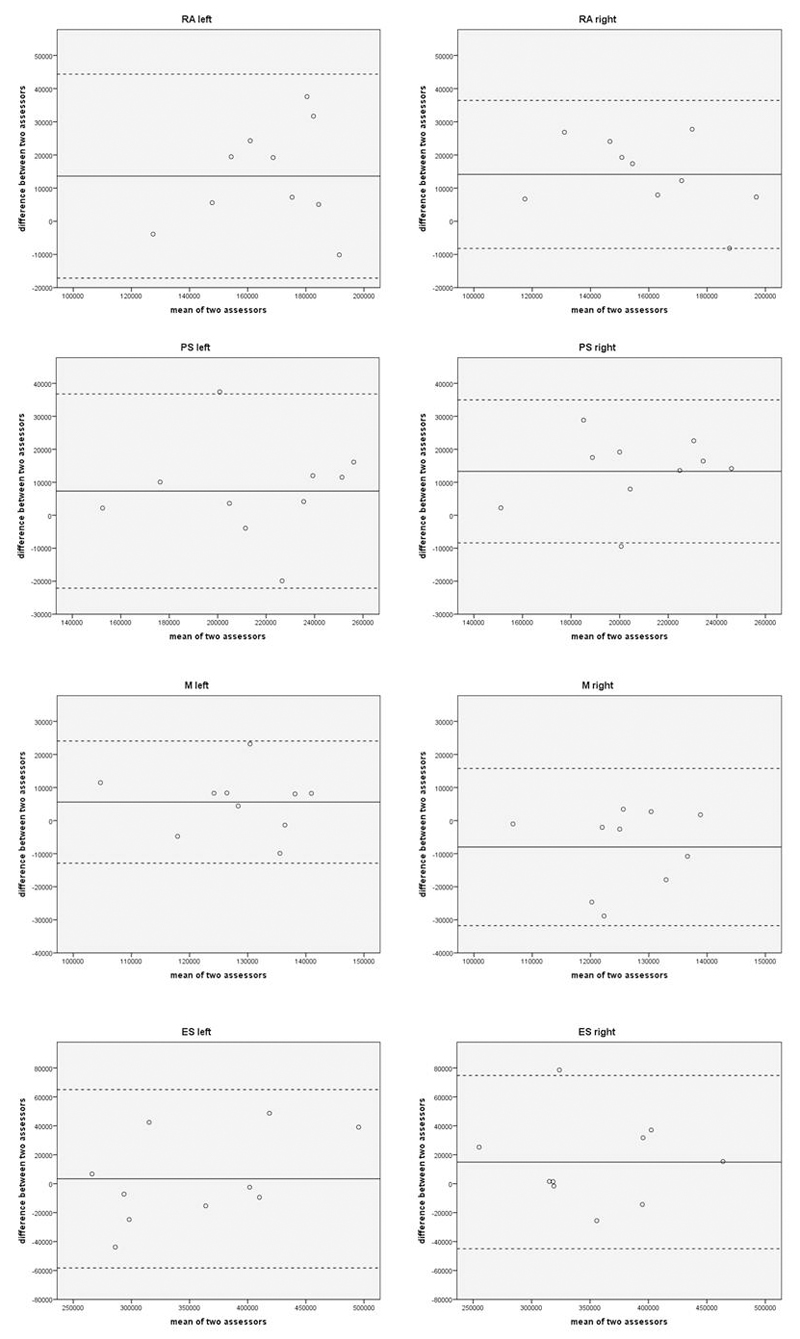
Figure 3.
Bland-Altman plots of muscle fatty infiltrate (MFI) of left and right rectus abdomins (RA), psoas (PS), multifidus (M) and erector spinae (ES). In each plot, the continuous line represents the mean difference between the two assessors, the bottom broken line the mean minus twice the standard deviation (mean – 2*SD), and the top broken line the mean add twice the standard deviation (mean + 2*SD).

