
Figure 1. Positive Final Margin Cumulative Sum Learning Curve, Stratified by Surgeon.
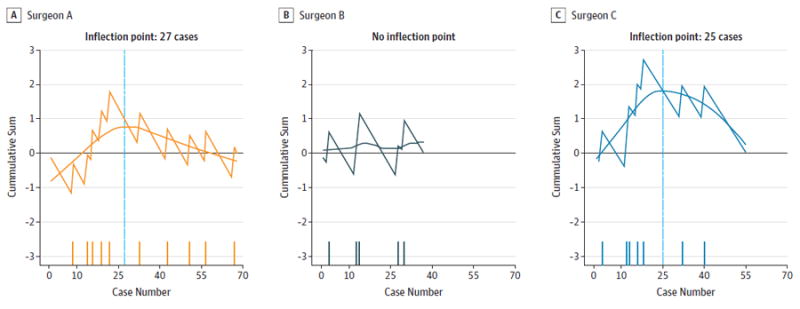
A-C, Surgeons A, B, and C. The horizontal reference at 0 denotes the individual final average. The y-axis denotes cumulative sum of the expected failure proportion from the series mean at each time point. The x-axis denotes consecutive cases. The blue vertical line indicates the inflection point. The dashes along the x-axis indicate positive margin cases.