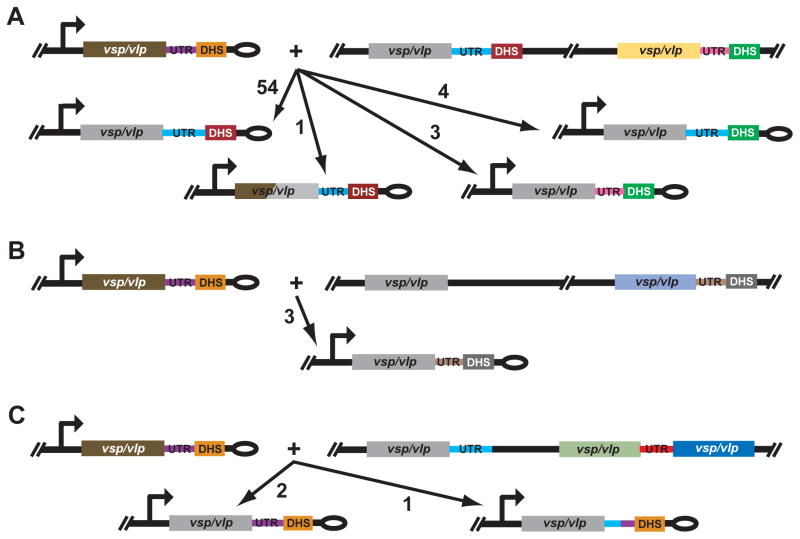
Figure 8.
Schematic representations of recombination outcomes for 68 relapse isolates of B. hermsii. The drawing is not to scale. The infecting serotype’s expressed vsp or vlp is shown as brown in panel A, B, and C; the direction of transcription is indicated by the arrow. The hair-pin telomere of the expression plasmid is denoted by an ellipse. The archival vsp or vlp gene that is the donor for each recombination is shown as gray for each recombination. Other vsp/vlp genes, their accompanying 3′ UTR sequences, and different DHS elements in the figure as denoted by other colors. The 3 panels differ in the characteristics of the archival site for the recombination. In panel A there is a DHS element adjacent to the 3′ untranslated region (UTR) for the donor archival gene and a more distant DHS downstream of another vsp or vlp and its 3′ UTR. In panel B the donor archival gene is at a distance from nearest DHS. In panel C there was not a downstream DHS element on the sequence fragment. In each panel the numbers next to the arrows with long arrowheads indicate the frequencies of each type of recombination event.

