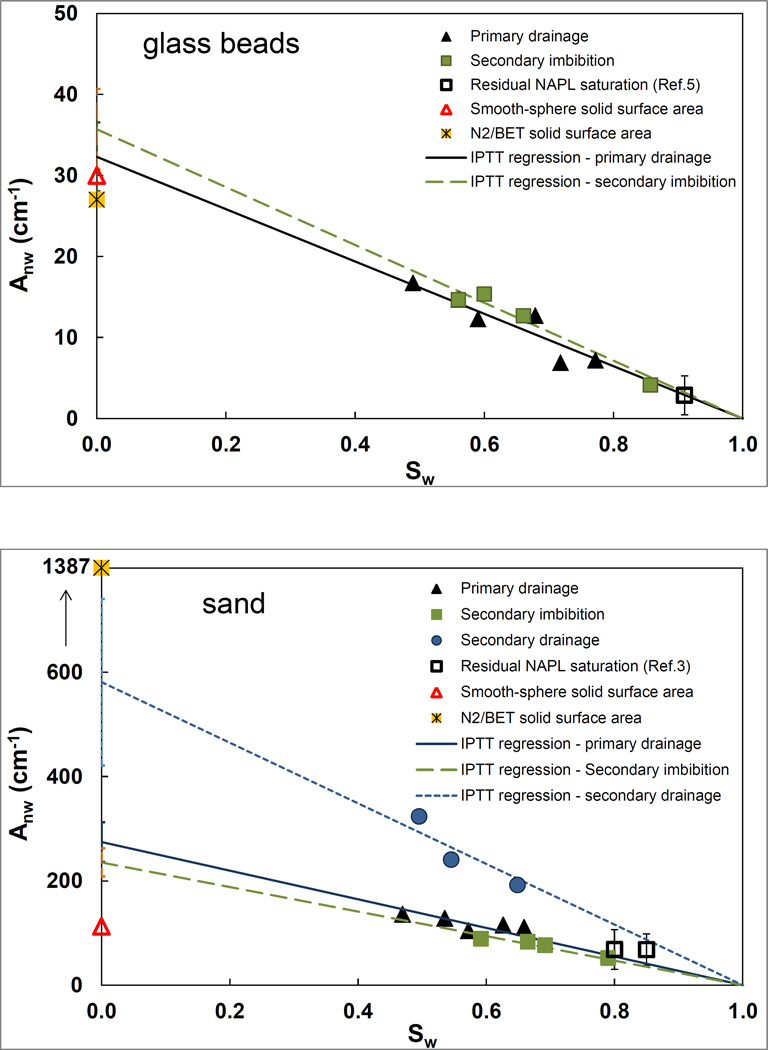
Figure 2.
Specific NW-W interfacial area (Anw) as a function of water saturation (Sw). Also included are (i) the geometric specific solid surface area, (ii) the specific solid surface area measured with the N2/BET method (note the expanded maximum values for the y-axis for the sand), and (iii) data obtained using the standard IPTT method with residual NW saturation (references [Brusseau et al., 2008, 2010; Narter and Brusseau, 2010]).

