Figure 1.

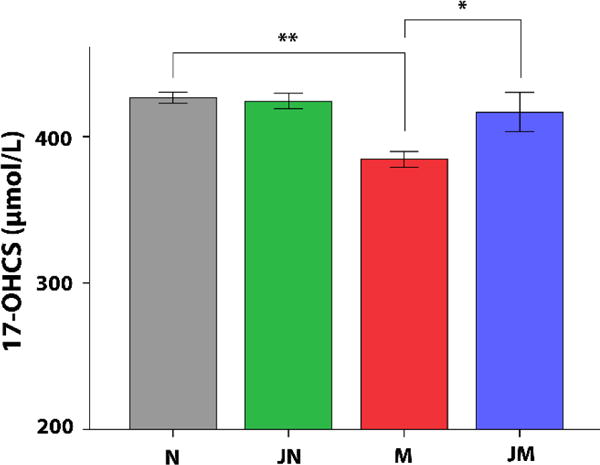
Concentration of twenty-four-hour urinary 17-OHCS in each group (mean ± SE). * P < 0.05; ** P < 0.01 compared to M group. There was no statistically significant difference between JM and N.

Concentration of twenty-four-hour urinary 17-OHCS in each group (mean ± SE). * P < 0.05; ** P < 0.01 compared to M group. There was no statistically significant difference between JM and N.