
Figure 3.
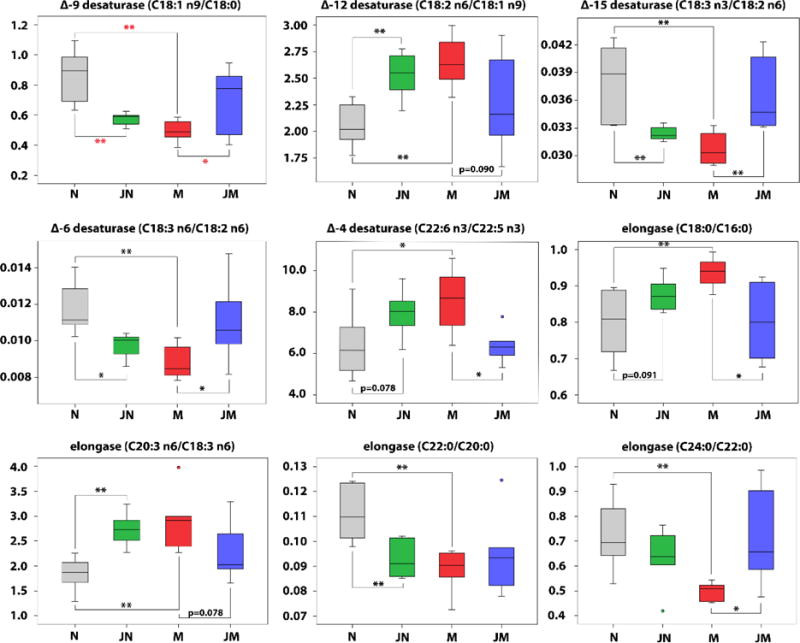
Box plots of 9 serum [product FFA]/[precursor FFA] ratios that were significantly changed in model group compared to controls. * P < 0.05; ** P < 0.01.
Official websites use .gov
A
.gov website belongs to an official
government organization in the United States.
Secure .gov websites use HTTPS
A lock (
) or https:// means you've safely
connected to the .gov website. Share sensitive
information only on official, secure websites.
Box plots of 9 serum [product FFA]/[precursor FFA] ratios that were significantly changed in model group compared to controls. * P < 0.05; ** P < 0.01.