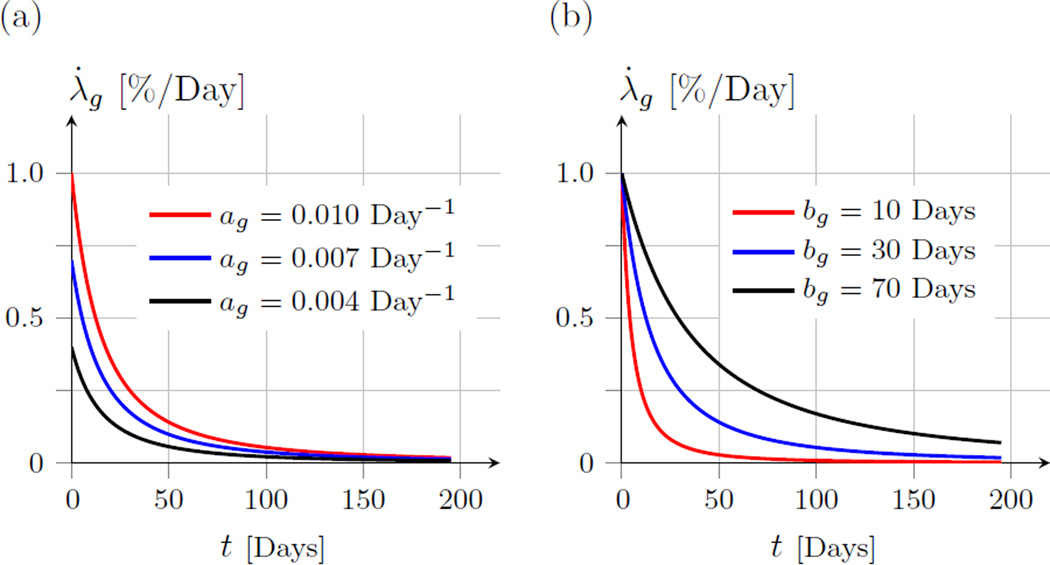
Fig. 1.
The growth stretch rate λ̇g as defined in (1). Illustrative plots are shown for different values of ag and bg. (a) Shows the effect of varying the parameter ag while bg = 30 Days. (b) Shows the effect of varying the parameter bg while ag = 0.01 Day−1. The parameter ag represents the growth rate at t = 0, while bg determines the shape of the growth rate function in (1).

