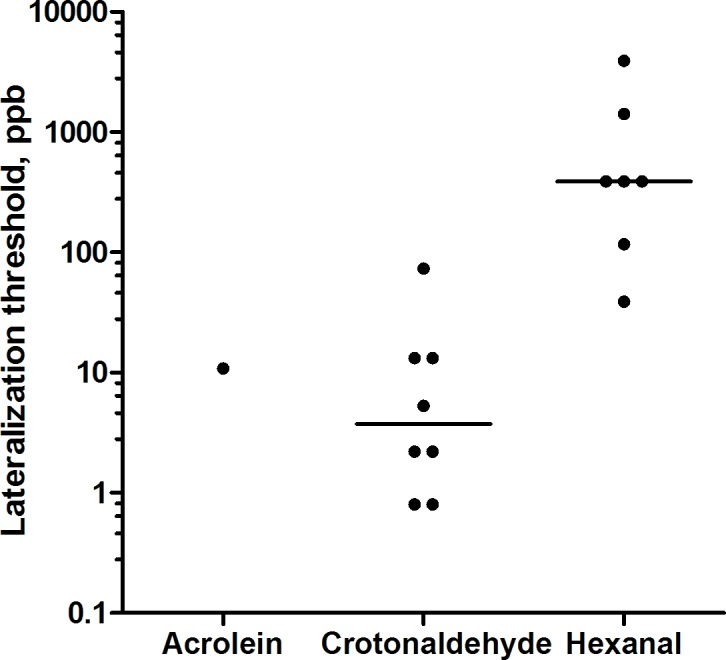
Fig 4. Measured lateralization thresholds of acrolein, crotonaldehyde, and hexanal.

Each dot represents the threshold for one individual. The horizontal lines represent median.

Each dot represents the threshold for one individual. The horizontal lines represent median.