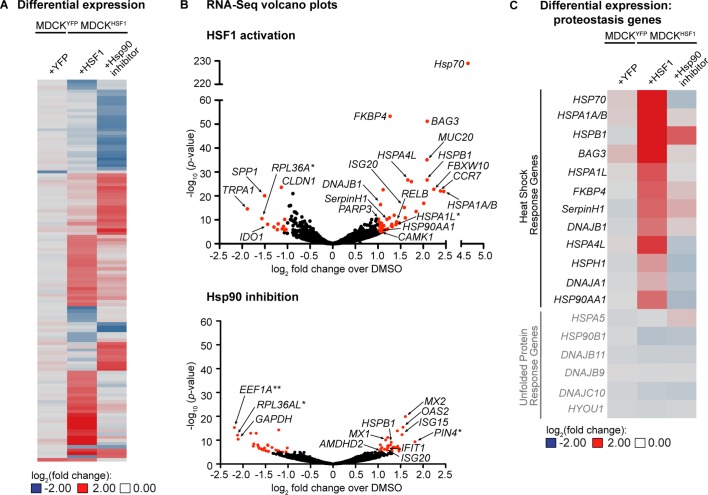
Figure 2. Transcriptomic analysis of perturbed host cell proteostasis environments.
(A) Differential expression analysis of MDCKHSF1 cells treated for 24 hr with 10 μM TMP (+HSF1) or 10 nM STA-9090 (+Hsp90 inhibitor) and MDCKYFP cells treated for 24 hr with 10 μM TMP (+YFP), normalized to vehicle treatment in the corresponding cell line. Transcripts displaying ≥2 fold changes in expression with p-values <10–5 for any of the treatments are included in the heat map (118 transcripts total). (B) Volcano plots showing the global distribution of expressed transcripts upon HSF1 activation or Hsp90 inhibition as in Figure 2A. Transcripts displaying ≥2 fold changes in expression with p-values <10–5 are shaded red. Outliers and transcripts encoding proteostasis network components, stress response genes, and transcription factor modulators are labeled. *=unannotated canine genes homologous to the indicated gene across multiple species; **=unannotated canine genes that fell within the indicated paralog gene family with partial homology. (C) Heat map showing the differential expression of heat shock response and unfolded protein response gene transcripts upon HSF1 activation or Hsp90 inhibition as in Figure 2A. Figure 2—source data 1. RNA-Seq characterization of MDCKHSF1 and MDCKYFP cells: quality control metrics. Figure 2—source data 2. RNA-Seq characterization of MDCKHSF1 and MDCKYFP cells: differential transcript expression. Figure 2—source data 3. RNA-Seq characterization of MDCKHSF1 and MDCKYFP cells: list of all transcripts displaying ≥2 fold changes in expression with p-values <10–5 for each treatment.

