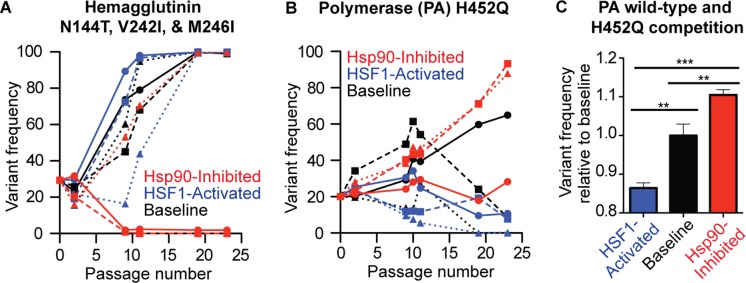
Figure 6. HA and PA display divergent mutational trajectories in HSF1-activated versus basal versus Hsp90-inhibited environments.
(A) Mutational trajectories of HA variants for each biological replicate in all three proteostasis environments; note that the N144T, V242I, and M246I variants all have identical trajectories. (B) Mutational trajectories of the PA H425Q variant for each biological replicate in all three proteostasis environments. (C) Reverse genetics competition between H452Q and wild-type PA in each proteostasis environment. Average variant allele frequency was normalized to that in the basal proteostasis environment. SEM for biological triplicates is shown. Statistical significance was calculated using a Student’s t-test.

