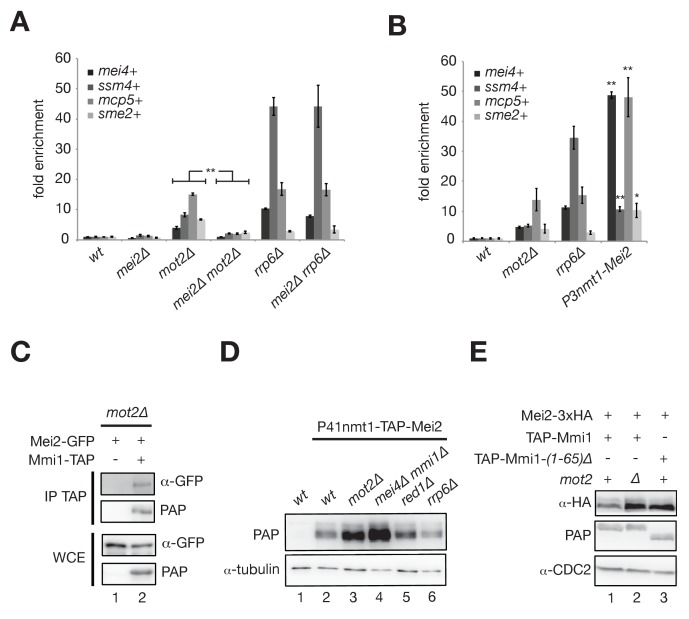
Figure 4. Mot2 functions with Mmi1 to limit the accumulation of Mei2 and meiotic mRNAs.
(A), (B) RT-qPCR analyses of meiotic transcripts in cells of the indicated genetic backgrounds and grown in minimal medium (EMM0.5X). Shown is the fold enrichment of RNAs levels normalized to act1+ transcripts and expressed relative to the wild type strain. Error bars represent the standard deviation from three independent experiments. (A) Pairwise comparisons of four meiotic transcripts in mot2∆ versus mei2∆ mot2∆ mutants give p-values<7.3E-3. (B) Stars denote statistical significance relative to wild type cells (t-test p-values: mei4+ = 1.29E-4; ssm4+ = 1.9E-3; mcp5+ = 6.3E-3; sme2+ = 2.04E-2). (C) Western blot showing that Mei2-GFP co-immunoprecipitates with Mmi1-TAP upon RNaseA/T1 treatment in mot2∆ cells grown in minimal medium (EMM0.5X). (D), (E) Western blots showing total Mei2 levels (P41nmt1-TAP-Mei2 in (D) or Mei2-3xHA in (E)) in cells of the indicated genetic backgrounds and grown in minimal medium (EMM0.5X). Anti-tubulin and anti-CDC2 antibodies were used as loading controls in panels (D) and (E), respectively.


