. 2017 Aug 25;6:e28046. doi: 10.7554/eLife.28046

Figure 6. The E3 ubiquitin ligase activity of Mot2 is required for repressing Mei2 during vegetative growth.

(A) Western blot showing total TAP-Mei2 levels expressed from the P41nmt1 promoter in cells of the indicated genetic backgrounds and grown in minimal medium lacking leucine (EMM-LEU0.5X). An anti-FLAG antibody was used to detect Mot2 variants expressed from the pREP41 vector. An anti-CDC2 antibody was used as loading control. The star denotes a non-specific band. (B) In vivo ubiquitination of Mei2-3xHA in wt, mot2∆ and ubr1∆ cells expressing 6His tagged-ubiquitin in minimal medium (EMM-LEU0.5X). Total and ubiquitinated Mei2 as well as ubiquitin conjugates were analyzed by immunoblotting using anti-HA and anti-ubiquitin antibodies respectively. An untagged wild type strain was used as negative control. The star denotes unmodified Mei2 molecules. (C) Quantification of Mei2 ubiquitinated species relative to total protein levels and expressed relative to Mei2-3xHA wild type cells. Error bars represent the standard deviation from five independent experiments. Stars denote statistical significance relative to Mei2-3xHA wild type cells (t-test p-values=2.29E-6 for mot2∆, and 5.64E-9 for ubr1∆). (D) RT-qPCR analysis of meiotic transcripts in wt, mot2∆ and ubr1∆ cells. Shown is the fold enrichment of RNAs levels normalized to act1+ transcripts and expressed relative to the wild type strain. Error bars represent the deviation from the mean of biological duplicates.

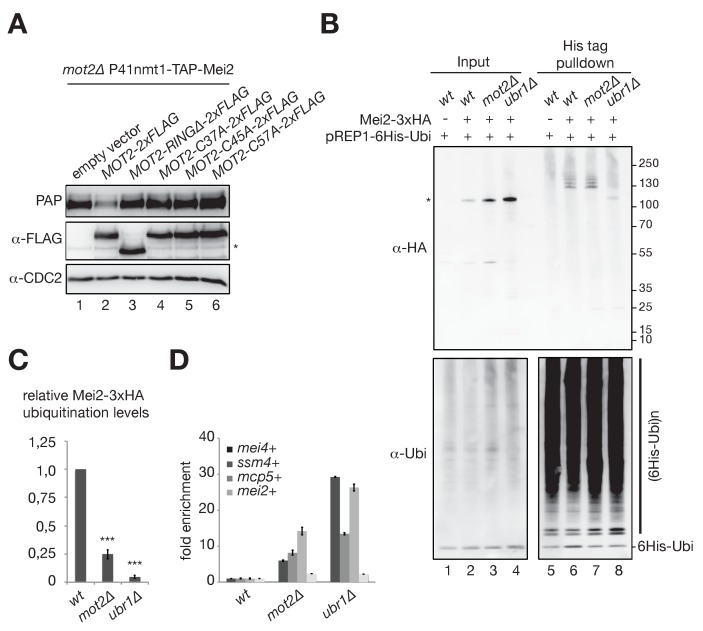
Figure 6.

Figure 6—figure supplement 1. Contribution of Mot2 to the ubiquitination of Mei2.

Figure 6—figure supplement 1.

(A) In vivo ubiquitination of Mei2-3xHA in wt and mot2∆ cells as described in Figure 6B. Samples of the mot2∆ mutant were serial diluted to estimate the levels of ubiquitinated Mei2 species when similar amounts of total Mei2 are used from the two strains. (B) In vivo ubiquitination of Mei2-3xHA as described in Figure 6B but in mts2-1 and mts2-1 mot2∆ cells grown in EMM-LEU0.5X at 28°C before a temperature shift at 37°C for 1 hr. (C) Quantification of Mei2 ubiquitinated species relative to total protein levels and expressed relative to mts2-1 cells. Error bars represent the standard deviation from three independent experiments. Stars denote statistical significance relative to the mts2-1 Mei2-3xHA strain (t-test p-value=1.89E-2). (D) In vivo ubiquitination of 3xFLAG-tagged Mei2 as described in Figure 6B but in cells expressing endogenous levels of the protein (e.g. Mei2-3xFLAG) or overexpressing it (e.g. P3nmt1-3xFLAG-Mei2). Total and ubiquitinated Mei2, as well as ubiquitin conjugates were analyzed using anti-FLAG and anti-ubiquitin antibodies respectively. Shown are short and long exposures for the anti-FLAG immunoblotting. (E) Quantification of Mei2 ubiquitinated species relative to total protein levels and expressed relative to Mei2-3xFLAG wild type cells. Error bars represent the deviation from the mean of biological duplicates.
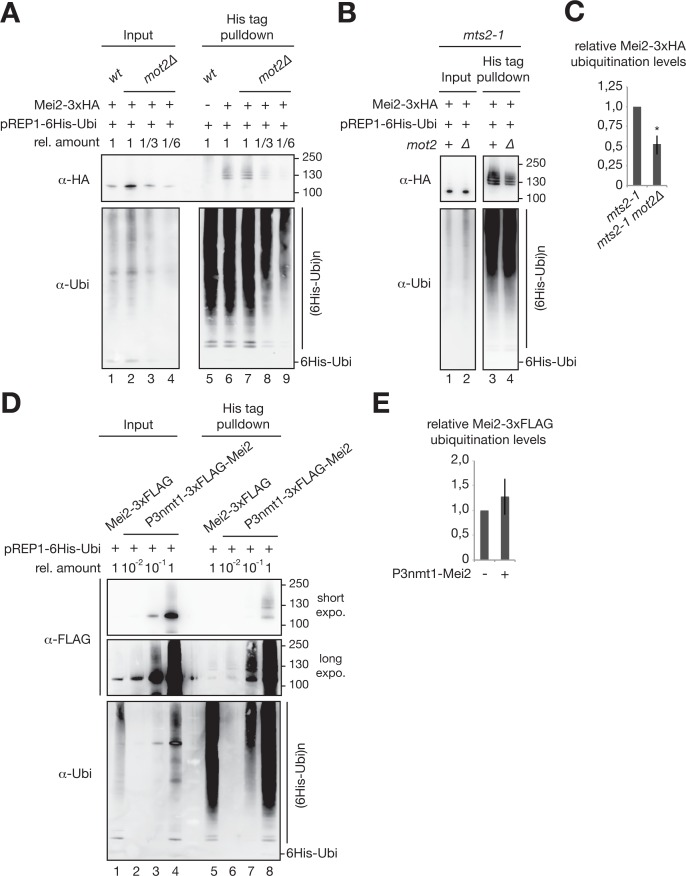
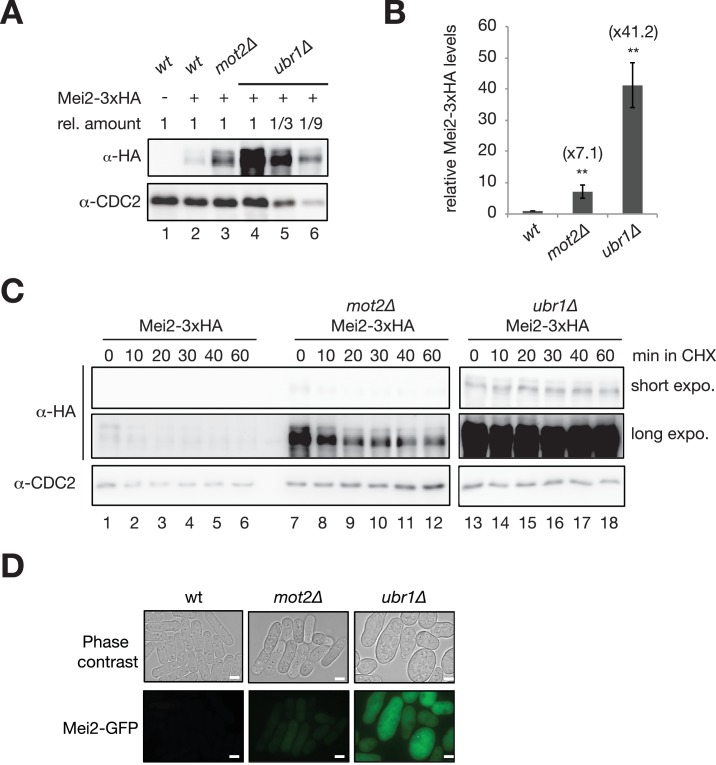
Figure 6—figure supplement 2. Both Mot2 and Ubr1 limit the accumulation of Mei2.

Figure 6—figure supplement 2.

(A) Representative Western blot showing total Mei2-3xHA levels in wt, mot2∆ and ubr1∆ cells grown in minimal medium (EMM0.5X) at 30°C. Mei2 was detected using an anti-HA antibody and an anti-CDC2 antibody was used as a loading control. (B) Quantification of total Mei2-3xHA levels, normalized to CDC2 and expressed relative to wild type cells. Error bars represent the standard deviation from five independent experiments. Stars denote statistical significance relative to Mei2-3xHA wild type cells (t-test p-values=2.66E-3 for mot2∆, and 2.25E-4 for ubr1∆). (C) Cycloheximide chase experiment of Mei2-3xHA in wt, mot2∆ and ubr1∆ cells. Cells were grown in minimal medium (EMM0.5X) at 30°C and harvested at the indicated time points following addition of 100 µg/mL cycloheximide. Mei2 was detected by immunoblotting using an anti-HA antibody and an anti-CDC2 antibody was used as a loading control. (D) Live cell microscopy of GFP-tagged Mei2 in wt, mot2∆ and ubr1∆ cells. Cells were grown in minimal medium (EMM0.5X) and imaged by phase contrast and with a GFP filter. Scale bars = 5 µm.