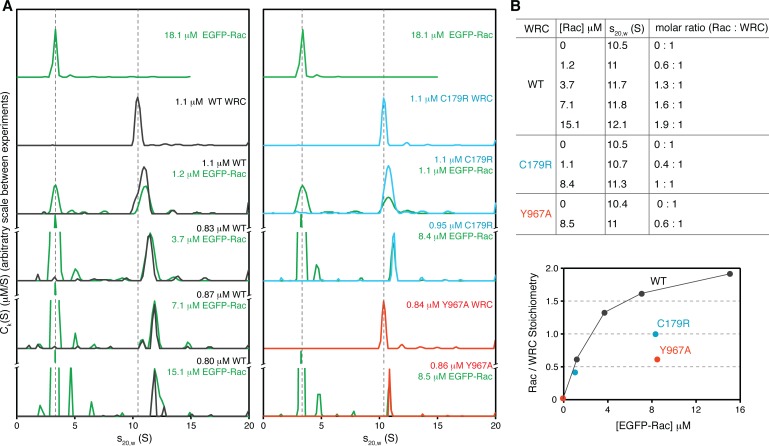
Figure 4. Stoichiometry of the Rac1/WRC complex determined by analytical ultracentrifugation.
(A) Sedimentation profiles (ck(s) distributions) of indicated samples at various concentrations (green for EGFP-Rac1 (Q61L/P29S), black for WT ΔWRC230, blue for C179R, and red for Y967A). Dashed lines are used as a reference to indicate the sedimentation coefficients of the WRC alone and EGFP-Rac alone, respectively. (B) Sedimentation coefficient and stoichiometry of Rac1/WRC in the WRC peak.


