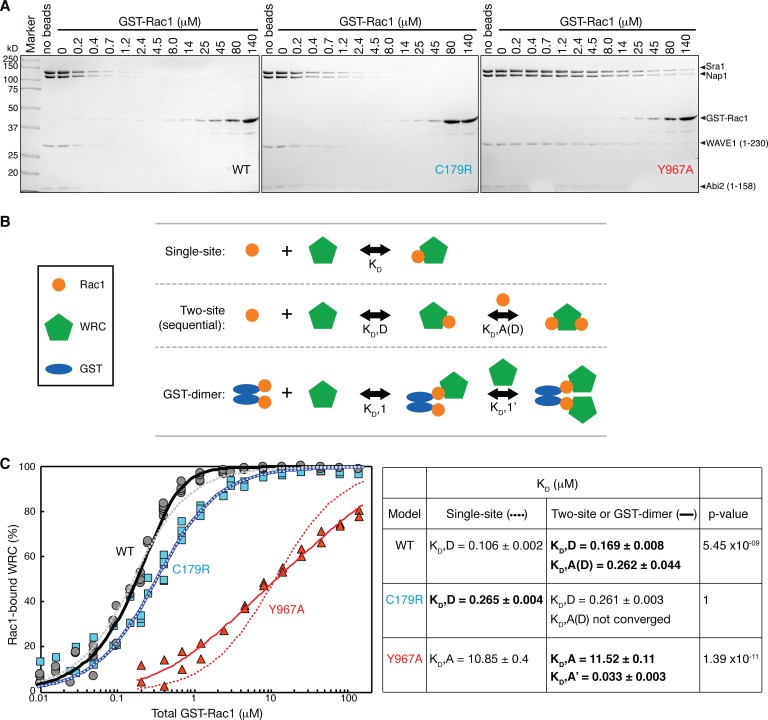
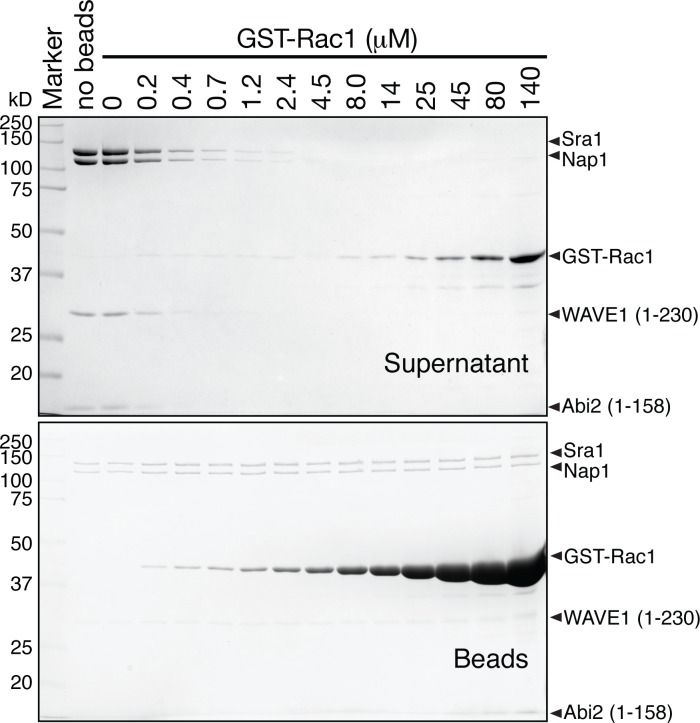
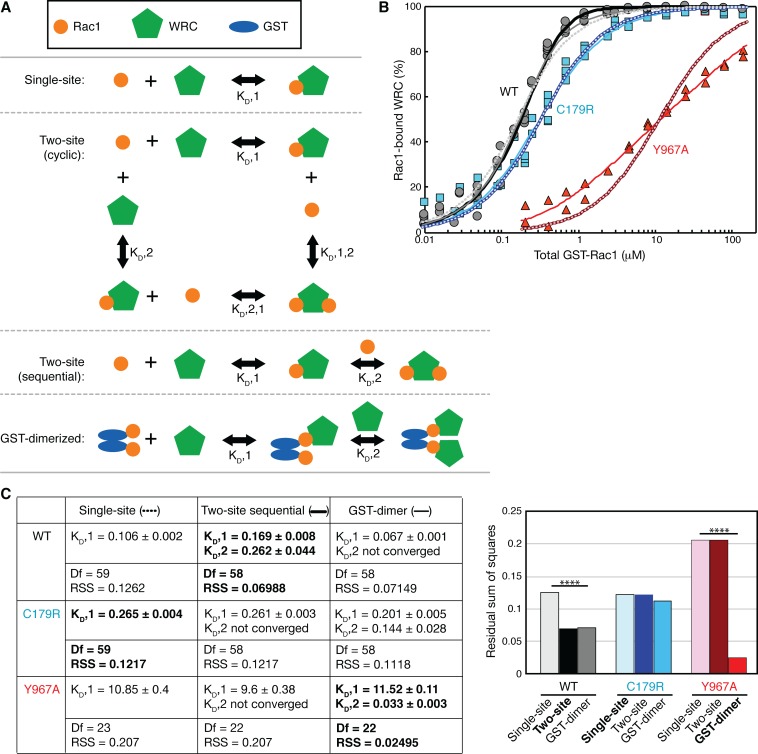
Figure 5. Quantification of the binding affinity by equilibrium pull-down assay.
(A). Representative Coomassie-blue-stained SDS-PAGE gels of the supernatant samples in equilibrium pull down experiments involving GST-Rac1 (Q61L/P29S) binding to ΔWRC230. (B) Schematic representation of the three successful equilibrium models used to fit the binding isotherms. (C) Binding isotherms fit to the indicated models. For WT and C179R ΔWRC230, results for single-site (dotted curves) and two-site (solid curves) models are shown. For Y967A WRC, results for single-site (dotted curves) and GST-dimer models (solid curves) are shown. The data were pooled from multiple independent experiments (5 experiments for WT and C179R, and 2 experiments for Y967A) covering various concentration ranges. Derived dissociation constants are shown in the right table, with KD,D representing the dissociation constant for the D Site, KD,A for the A Site, KD,A(D) for the A Site when the D Site is occupied by Rac1, and KD,A’ for the A Site of the second WRC in the GST-dimer model. Standard errors of the fit for the derived KD values are shown. p values were obtained by F-test; the most appropriate dissociation constants based on the p values are shown in bold. See Figure 5—figure supplement 2 and Methods for additional details.


