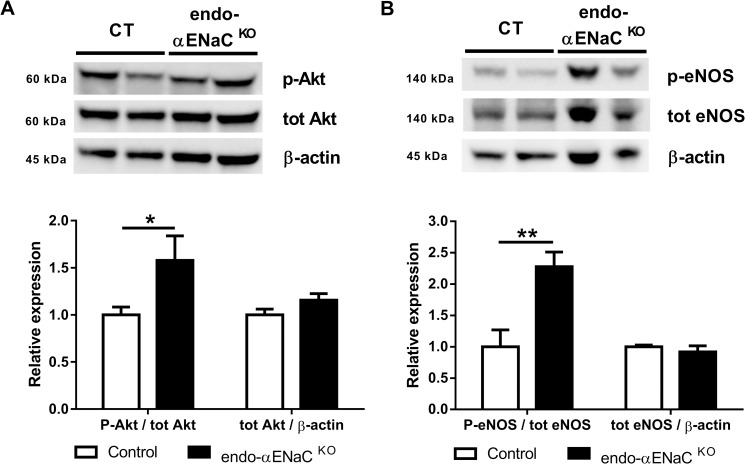
Fig 4. Consequences of αENaC gene inactivation on endothelial nitric oxide synthase activation pathway in the aorta.
Western Blot analysis of protein expression of (A) phosphorylated Akt/total Akt ratio and total Akt/β-Actin ratio and (B) phosphorylated eNOS (S1177)/total eNOS ratio and total eNOS/β-Actin ratio in the aorta. White bars represent control mice and black bars represent endo-αENaC KO mice. Values are mean ± SEM (n = 9–10 for each group). *P<0.05, **P<0.01.

