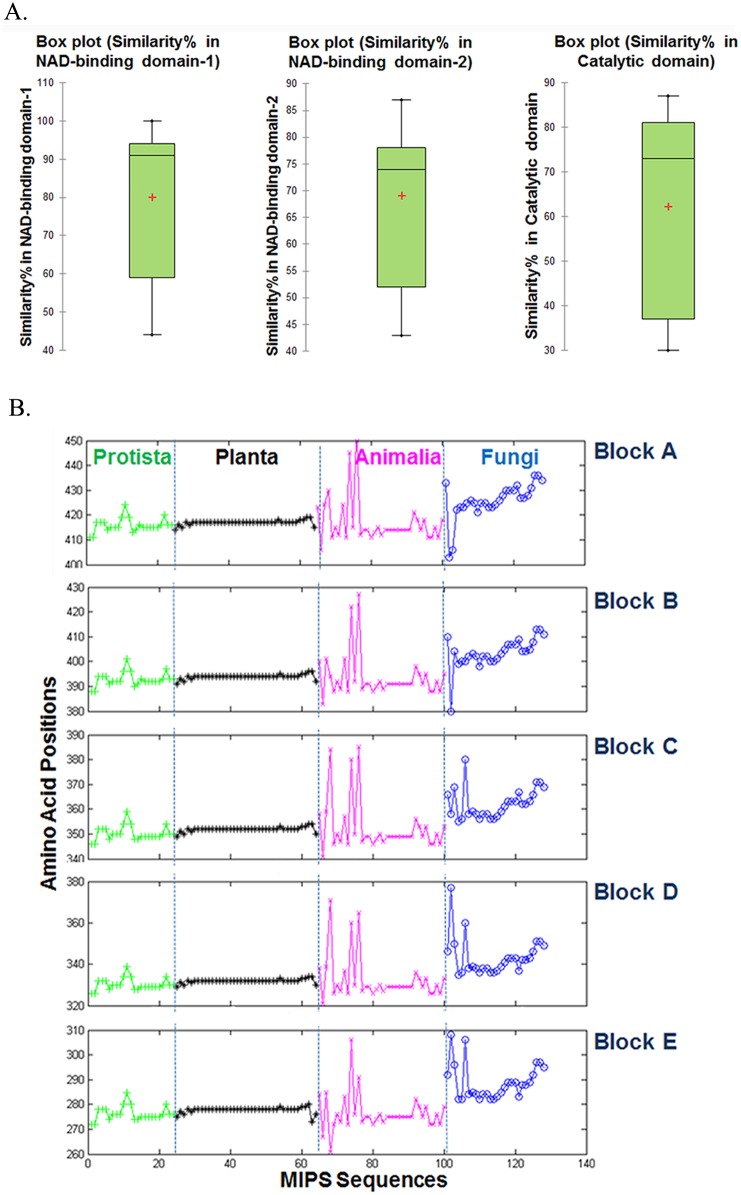
Fig 3. Homology stretches based on similarity percentage.
(A) Box- plot for Similarity % of three large conserved stretches across evolution. The horizontal line within each box denotes median values, ‘+’ sign denotes the mean value. (B) Loci of Blocks A to E are compared among the selected eukaryotic MIPS sequences.

