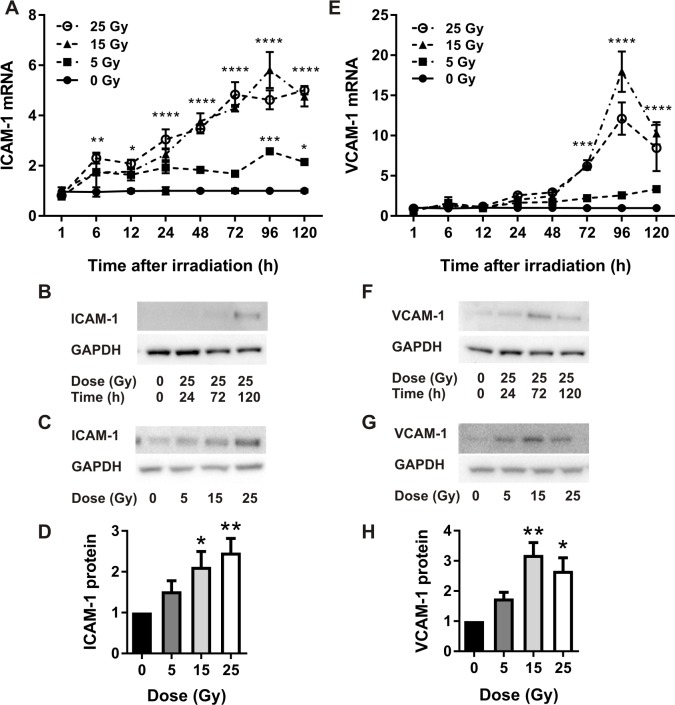
Fig 2. Quantitative real-time PCR and western analysis of ICAM-1 and VCAM-1 expression in irradiated bEnd.3 cells.
qRT-PCR analysis of ICAM-1 (A) and VCAM-1 (E) gene expression, n = 4 independent experiments. Representative western blots (time course) of ICAM-1 (B) and VCAM-1 (F) protein at 25 Gy. Representative western blots (dose response) of ICAM-1 expression (120 h) (C) and VCAM-1 expression (72 h) (G) post-irradiation. ICAM-1 (D) and VCAM-1 (H) protein expression quantitated using Image J, n = 4. Values are mean ± SEM. Data were normalized to GAPDH (westerns) or HPRT (qRT-PCR).

