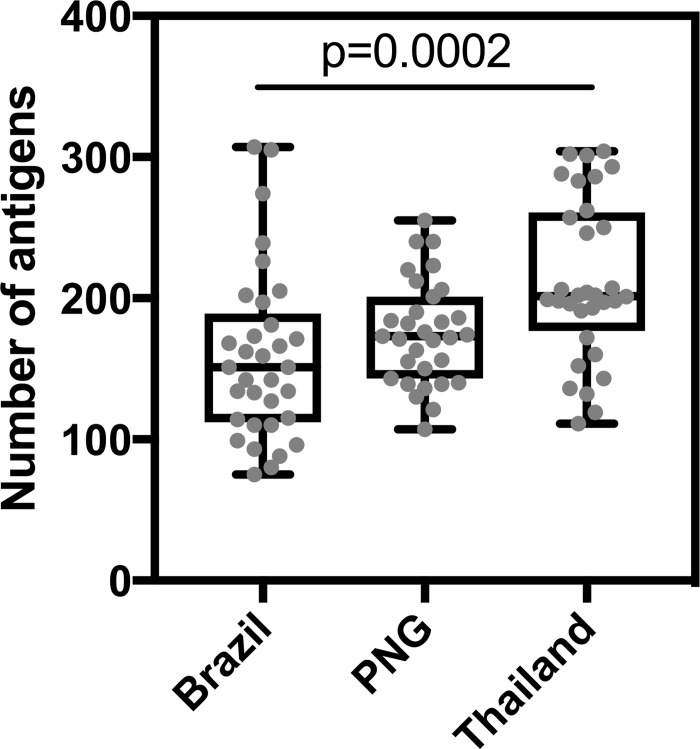
Fig 3. Breadth of the antibody response per person per cohort, at the time of P. vivax infection.
The number of antigens each individual was seropositive for is shown, with box-plots indicating the median and ranges for each cohort site. Statistical difference was assessed using the Kruskal-Wallis test (p = 0.0004); after adjustment for multiple comparisons with Dunn’s test, p = 0.0002 between Brazil and Thailand only.

