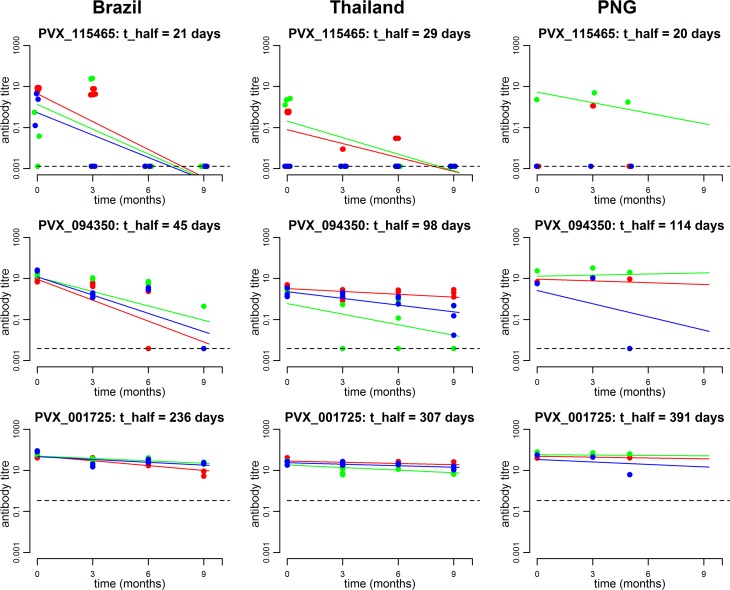
Fig 5. Example of antibody longevity to three different proteins for three randomly selected participants from each of the three study sites.
The first row provides an example of a typical protein inducing a short-lived antibody kinetic profile; the middle row provides an example of a moderate-lived profile; the final row provides an example of an exceptionally long-lived profile. Each plot provides data from three individuals, who are differentially colour coded. The dashed line denotes the sero-positivity cut-off.

