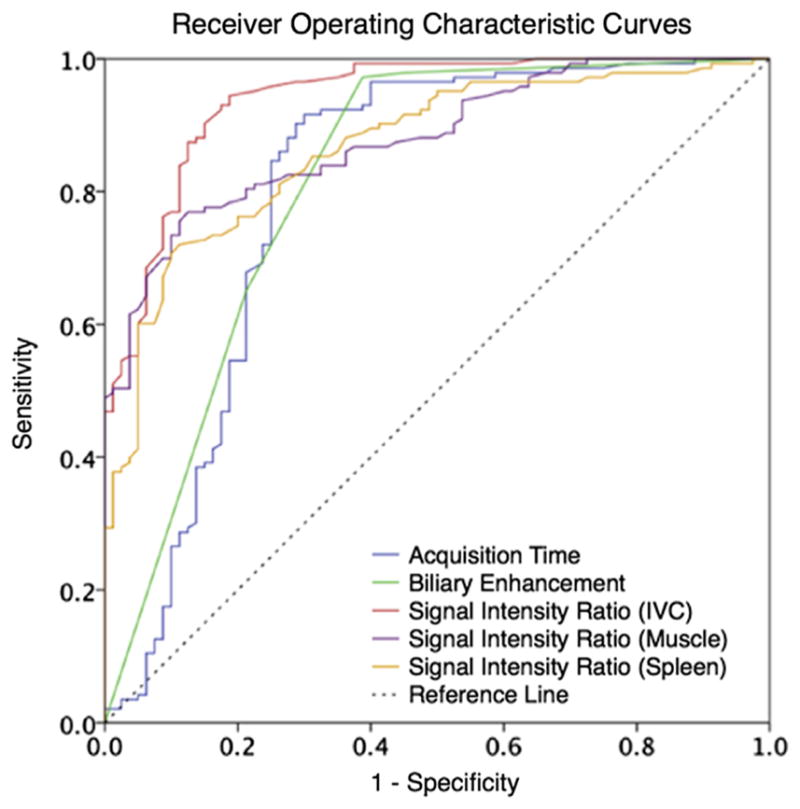
Figure 2.

ROC curves for image characteristics associated with hepatocyte phase adequacy. SIRliver/IVC was the best predictor of phase adequacy (AUROC = 0.94), followed by SIRliver/muscle (AUROC = 0.88), SIRliver/spleen (AUROC = 0.87), biliary enhancement (AUROC = 0.82), and acquisition time (AUROC = 0.80). AUROC, area under the receiver operating characteristic; IVC, inferior vena cava; SIR, signal intensity ratio. (Color version of figure is available online.)
