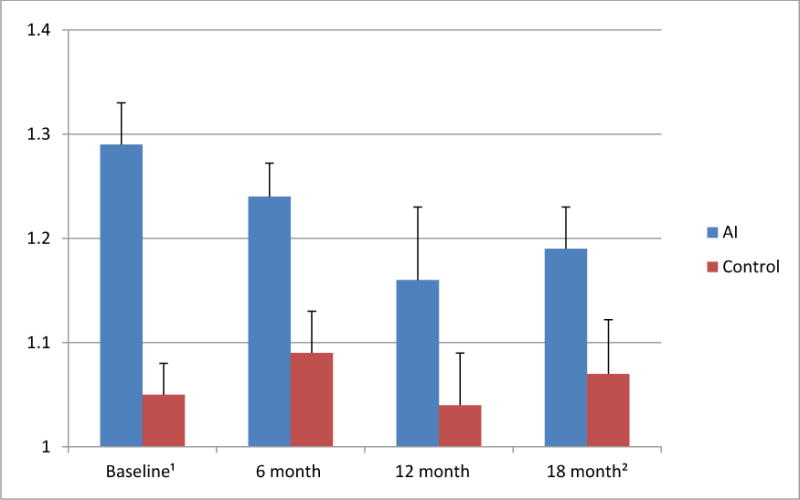
Figure 2. Average OHIP-14 scores of women with BCa treated with AI vs. women without cancer diagnoses at the four points in time.

1 Note that the average OHIP-14 score can range from 1 = best oral health-related quality of life (OHRQoL) to 5 = worst OHRQoL. The wording of the 14 OHIP items is included in Table 3.
2 The results of the repeated measurement univariate analysis of variance showed that the main effect “Treatment” AI use vs. control group (p= 0.017) and the main effect “Time” Baseline vs. 6 month vs. 12month vs. 18month visits (p= 0.005) were significant, while the interaction effect “Treatment” × “Time” was not significant (p=0.061).
Note that the Cronbach alpha inter-item consistency coefficients for the mean OHIP-14 scores at each point in time showed sufficient reliability (alpha at Time 1= 0.856; alpha at Time 2=0. 829; alpha at Time 3=0.829; alpha at Time 4=0.898).
