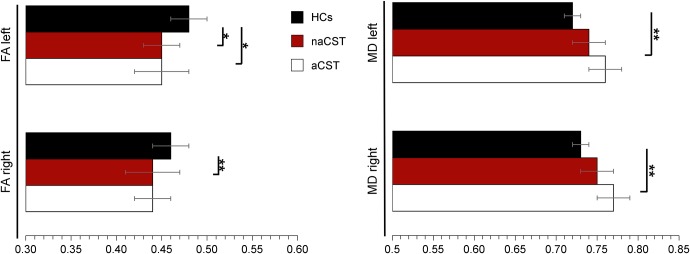
Figure 3. Comparison of diffusion values between corticospinal tracts (CST) of controls and CSTs of the patients not affected (naCST) or affected (aCST) by white matter lesions.
Means (horizontal bars) and standard deviations (whiskers) are given. HCs = healthy controls; FA = fractional anisotropy; MD = mean diffusivity. MD is given in mm2/s * 10–3. *P < 0.005; **P < 0.001.

