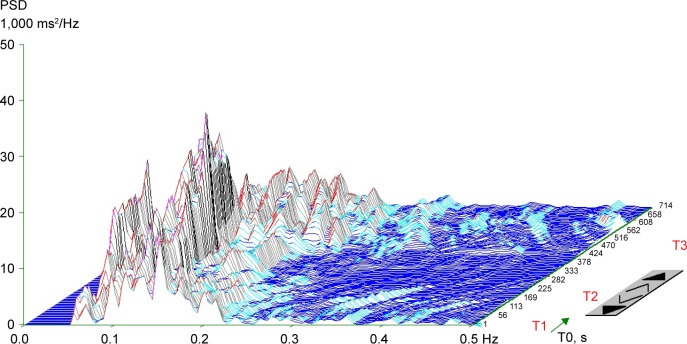
Figure 1.
Typical three-dimensional chart of a spectral analysis of heart-rate variability during orthostatic load in the cardiac autonomic reactivity group.
Notes: Standing augmented the low-frequency power (0.05–0.15 Hz) and reduced the high-frequency power (0.15–0.4 Hz) in T2 due to baroreceptor unloading and reduced vagal activity. High-frequency power was augmented in the repeated supine position in T3. The frequency of fluctuations in R-R intervals (Hz) is given on the x-axis; power spectral density (PSD; ms2/Hz) on the y-axis; and time (s) on the z-axis. T1: supine-1, T2: standing, T3: supine-2.

