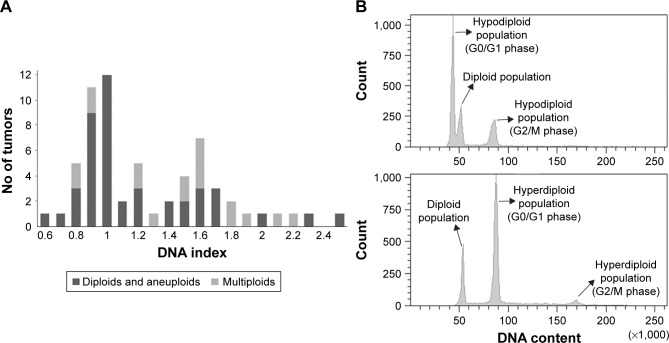
Figure 1.
(A) DNA index distribution in the 53 patients with peritoneal carcinomatosis from ovarian cancer. The DNA index of all the cell populations present in the sample was considered for multiploid tumors (light gray bars). (B) Representative flow cytometric histogram plots of two samples and DNA diploid internal control.

