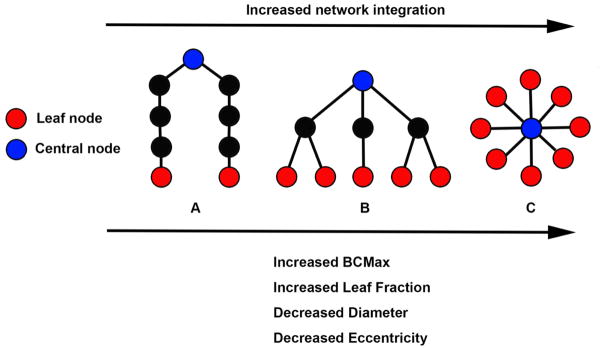
Figure 2.
Schematic representation of three minimum spanning trees (MSTs) consisting of nine nodes. MST structures can range between a path-like tree (i.e., less integrated network) to a star-like tree (i.e. more integrated network). The figure shows examples of a path-like (A), hierarchical (B) and star-like tree (C). Red nodes represent leaf nodes (i.e. end-nodes in the graph). Blue nodes represent central nodes. In A, the blue node characteristics are: betweenness centrality = 16 (indicating there are 16 “shortest-paths” connecting any two nodes through that node) and eccentricity = 4 (indicating the longest distance between that node and any other node). Red node characteristics are: betweenness centrality = 0 and eccentricity = 8. Tree characteristics are BCMax = 16, leaf fraction = 0.25 (indicating 2 leaf nodes divided by the potential maximum of 8 leaf nodes as can be observed in figure C), Diameter (i.e. the longest path in the network) = 8, average eccentricity = 6.2. In B, blue node characteristics are: betweenness centrality = 21 and eccentricity = 2. Red node characteristics are betweenness centrality = 0 and eccentricity = 4. Tree characteristics are BCMax = 21, leaf fraction = 0.625, diameter = 4 and average eccentricity = 3.4. In C, blue node characteristics are betweenness centrality = 28 and eccentricity = 1. Red node characteristics are betweenness centrality = 0 and eccentricity = 2. Tree characteristics are BCMax = 28, leaf fraction = 1, diameter = 2, average eccentricity = 1.9. Path-like trees have the disadvantage of being inefficient in the transfer of information, while the star-like tree at the other side of the spectrum has the advantage that information can spread easily across the network, but the central node might suffer from overloading of information. A hierarchical tree is a hypothesized optimal topology. Please note that the values described above indicate the raw graph values. In the present study, these values are normalized for network size, yielding graph measure values ranging from 0 to 1. BCMax = maximum betweenness centrality. Figure is adjusted from (Numan et al., 2017; van Dellen et al., 2014).

