
Figure 12. DCC-derived brain states averaged across subjects for each of the four HCP runs.
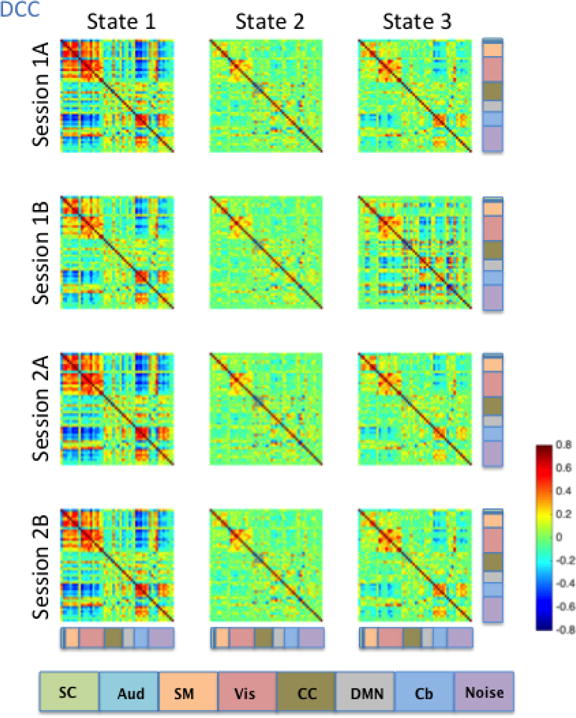
Brain states were determined using the cluster centers from k-means clustering. The functional label assigned to each signal node is indicated using the color code located at the bottom of the figure.