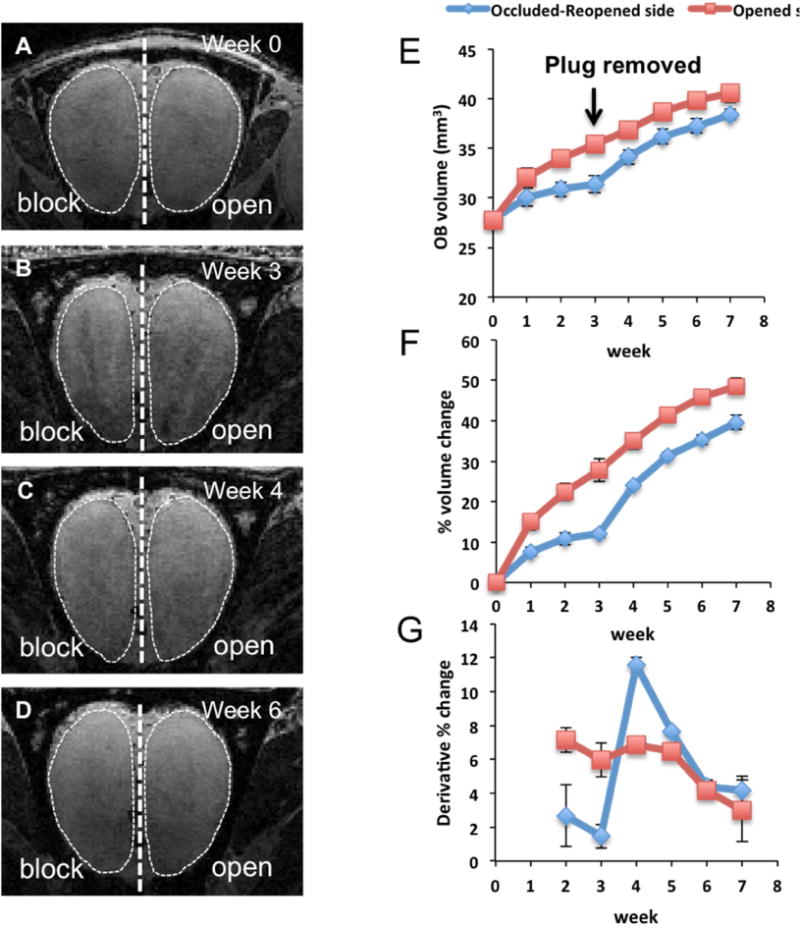
Figure 1.

Changes in OB volumes after unilateral naris occlusion in 3-week old rats. (A-B) MRI images of the OB during naris occlusion period (week 0 refers to initiation of naris occlusion). (C-D) images of the OB from the same animal during recovery period, during which the naris occlusion was reopened. E) Plot of average OB volume vs. time course of activity manipulation (N =6). F) Accumulative percentages of OB volume changes during the experiment. Percentage of changes in volume at each time point was normalized with the initial volume (at week 0). G) Derivatives of OB volume changes that occurred in each week was calculated by subtraction of the percentages of changes in volume (obtained from figure 1F) from previous week.
