Figure 6.

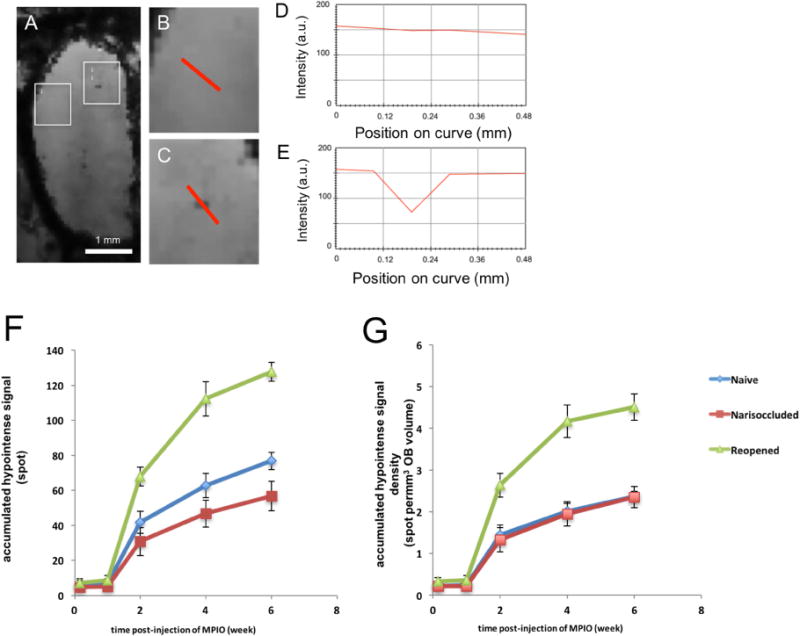
Assignment of MRI hypointensities as surrogate marker of MPIO(+) cells in the OB and dynamics of new cell addition into the OB. (A) representative image of a single slice (75 μm thick) from 3D MRI image of the OB following 2 weeks after MPIO injection. Appearance of hypointense spots could be seen distributed throughout the OB. (B) Enlarged image of boxes i from (A) that show measurement of signal intensities across the areas that had no hypointense spot (from MPIO). (C) Enlarged image of boxes i from (A) that show measurement of signal intensities across the area with hypointense spot. (D) and (E) show signal intensities across the curves that are shown in red in images B and C, respectively. (F) Graph shows the total numbers of dark pixels found in OB, excluding medial plane that was assigned to subependymal layer. (G) Graph B represents the density of new cells, which derived from graph (F) but taken into the account of OB volume from the corresponding time points.
