
Figure 3. Targeted captured sequencing of sgRNA sites in AAV-mTSG induced mouse GBM.
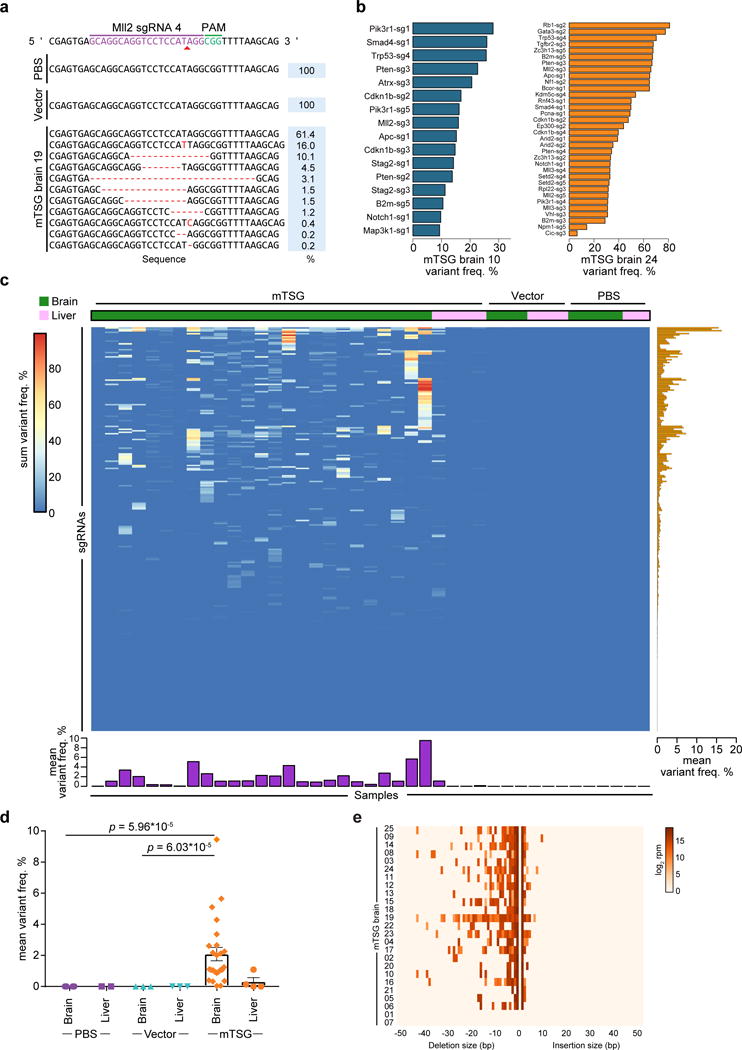
(a) Indel variants observed at the genomic region targeted by Mll2 sgRNA 4 in representative PBS, AAV-vector, and AAV-mTSG injected mouse brain samples.
(b) Bar plots of variant frequencies in significantly mutated sgRNA target regions from two representative AAV-mTSG injected mouse brain samples.
(c) Heatmap of variant frequency across all targeted capture samples (n = 41). Rows denote individual sgRNAs, while columns correspond to samples from mice stereotaxically injected with PBS, AAV-vector, or AAV-mTSG. The liver was considered an off-target organ and thus was used as a background control. Bar plots of the mean variant frequencies for each sgRNA (right panel, orange bars) and each sample (bottom panel, purple bars) are shown.
(d) Dot plot of mean variant frequency ± s.e.m., grouped by treatment condition and tissue type. AAV-mTSG injected brains had significantly higher mean variant frequencies (2.087 ± 0.429, n = 25) compared to vector (0.005 ± 0.001, n = 3) or PBS (0.003 ± 0.001, n = 4) injected brains (two-tailed Welch’s t-test, t24 = 4.85 and t24 = 4.86, p = 6.03 * 10−5 and p = 5.96 * 10−5 for mTSG vs. vector and mTSG vs. PBS). Comparing brain vs. liver in AAV-mTSG injected mice, mean variant frequencies of brains (2.087 ± 0.429) were significantly higher than livers (0.309 ± 0.261, n = 4) (t21.48 = 3.54, p = 0.002).
(e) Indel size distribution for all filtered variants in each mTSG brain sample (n = 25).