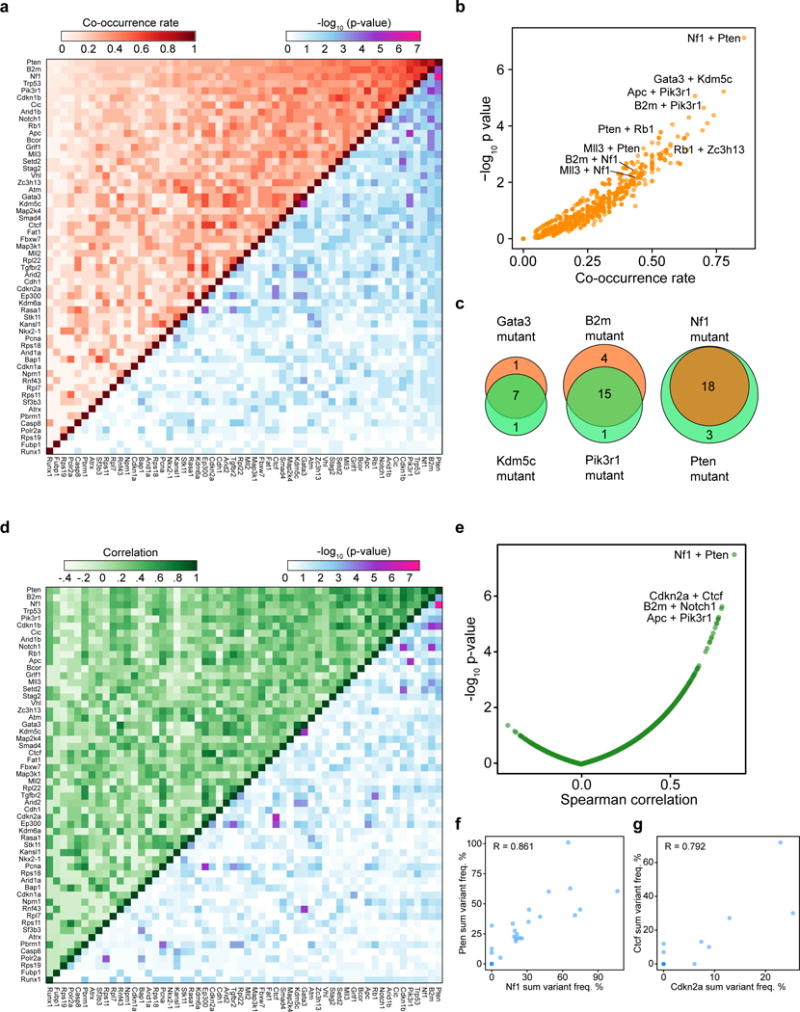
Figure 5. Co-mutation analysis uncovers synergistic gene pairs in GBM.

(a) Upper-left half: heatmap of pairwise mutational co-occurrence rates. Lower-right half: heatmap of -log10 p-values by hypergeometric test for statistical co-occurrence.
(b) Scatterplot of the co-occurrence rate of each gene pair, plotted against −log10 p-values.
(c) Venn diagrams showing representative strongly co-occurring mutated gene pairs such as Kdm5c and Gata3 (co-occurrence rate = 77.8%, hypergeometric test, p = 6.04 * 10−6), B2m and Pik3r1 (70.0%, p = 2.28 * 10−5), as well as Nf1 and Pten (85.7%, p = 7.53 * 10−8).
(d) Upper-left half: heatmap of the pairwise Spearman correlation of variant frequency for each gene, summed across sgRNAs. Lower-right half: heatmap of −log10 p-values to evaluate the statistical significance of the pairwise correlations.
(e) Scatterplot of pairwise Spearman correlations plotted against −log10 p-values.
(f–g) Scatterplots showing representative strongly correlated gene pairs when comparing variant frequencies summed across sgRNAs, such as Nf1+Pten (f) and Cdkn2a+Ctcf (g). Spearman correlation coefficients are noted on the plot.
