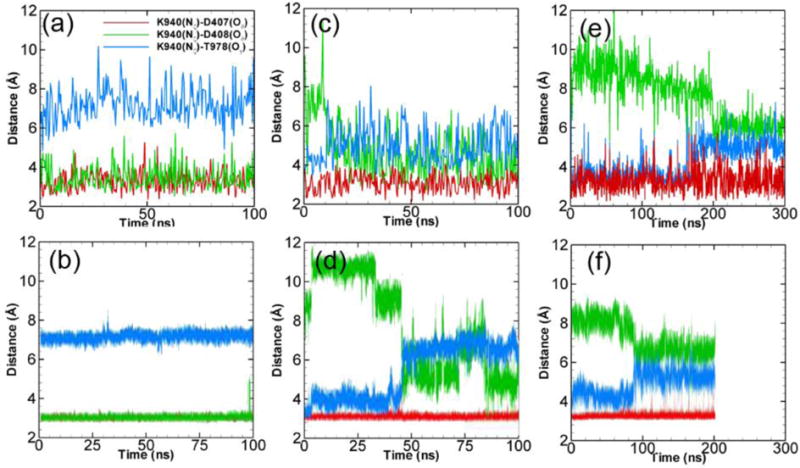
Figure 3.

Side chain dynamics at the TM domain. The time evolution of K940-D407 (red), K940-D408 (green) and K940-T978 (blue) distances for monomer II (model 1) (a), monomer III (model 1) (c) and monomer III (model 2) (e). (b), (d) and (f) shows the corresponding results of all-atom simulations from Ref.18 (Simulation results from the second realization can be found in Figure S1 from ESI.)
