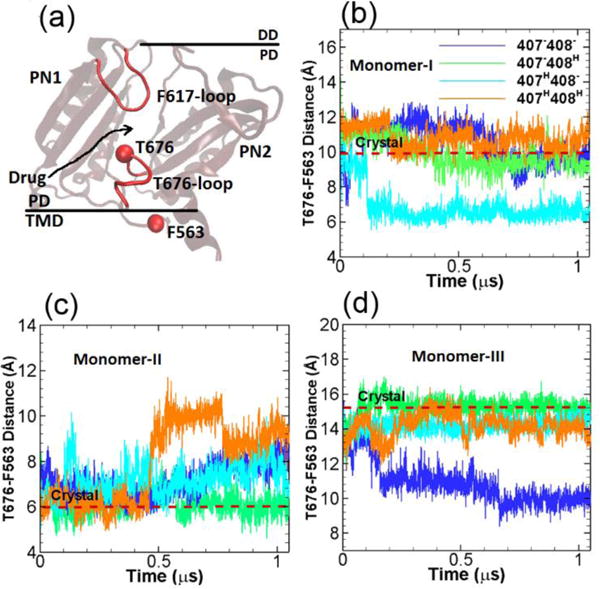
Figure 4.

Cleft entrance. (a) Illustration of the relative locations of T676-loop, F617-loop in the porter domain and F563 in the TM domain. The time evolution of the T676-F563 distances in monomer I (b), monomer II (c) and monomer III (d) for the four model systems listed in Table 1. The values of T676-F563 distance in crystal structure (PDB ID: 2DHH) for the three monomers are indicated by red dashed lines for comparison. (Simulation results from the second realization can be found in Figure S2 from ESI.)
