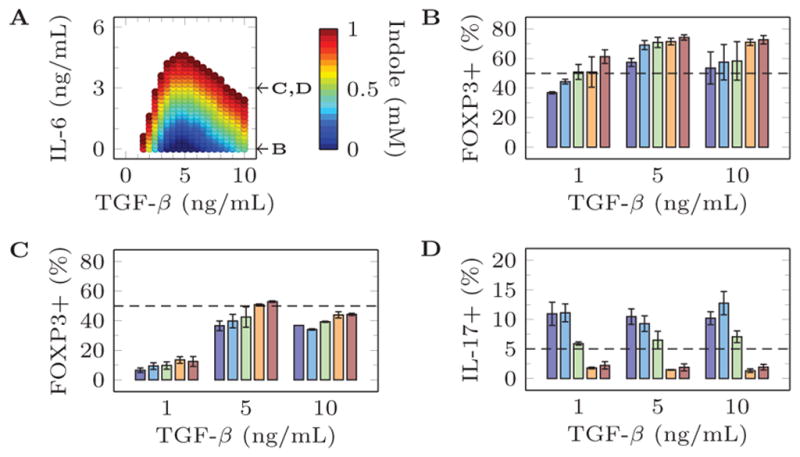
Figure 4.

Comparison of model predictions and experimental validation for 0 ng/mL Il-23, 500 U/mL IL-2, and selected concentrations of other metabolites. (a) Model predictions producing more than 50% FoxP3+ and less than 5% Th17 cells. (b) Experimental validation of percentage of FOXP3+ cells after stimulation with 0 ng/mL Il-23, 500 U/mL IL-2, 0 ng/mL IL-6, {1,5,10} ng/mL TGF-β, and {0, 0.25, 0.5, 0.75, 1} mM Indole. (c) Experimental validation of percentage of FOXP3+ cells after stimulation with 0 ng/mL Il-23, 500 U/mL IL-2, 3 ng/mL IL-6, {1,5,10} ng/mL TGF-β, and {0, 0.25, 0.5, 0.75, 1} mM Indole. (d) Experimental validation of percentage of IL-17+ cells after stimulation with 0 ng/mL Il-23, 500 U/mL IL-2, 3 ng/mL IL-6, {1,5,10} ng/mL TGF-β, and {0, 0.25, 0.5, 0.75, 1} mM Indole.
