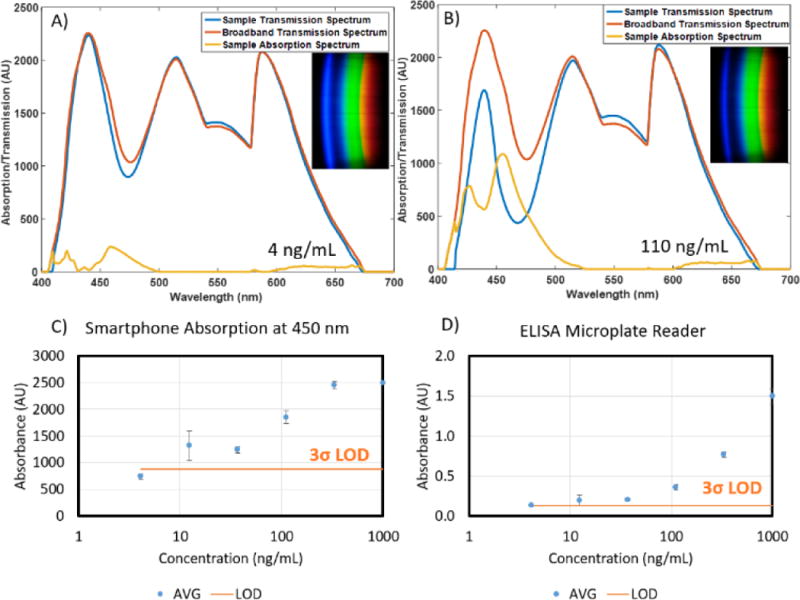
Figure 5.

A) and B) Sample transmission spectra, absorption spectra, and raw RGB image data (insets) for 4 and 110 ng/mL samples of fFN, respectively. C) and D) Comparative dose-response curves for spectral TRI-analyzer and 96-well microplate reader. Standard concentrations from 4 to 1000 ng/mL were assayed along with a human serum sample spiked at 50 ng/mL (not shown). Limit of detection was determined as 3 standard deviations over the mean of zero concentration standard (n=3).
