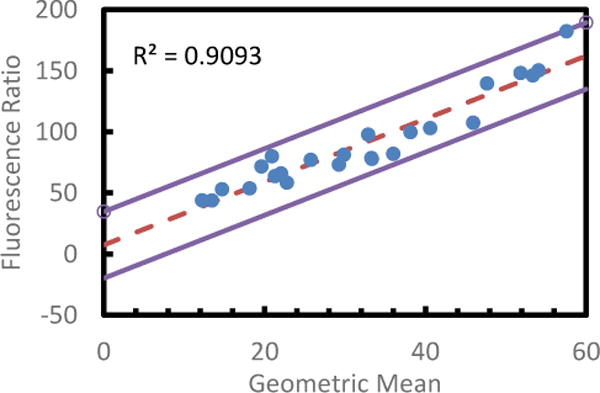
Figure 8.

Bland-Altman Analysis of Spectral TRI-Analyzer compared with standard microplate reader for readout of phenylalanine assay. A variation on the standard Bland-Altman method using the geometric mean and log difference was applied to all non-zero values for each assay (Bland). The log differences showed a dependence on the magnitude of the measurement, so a regressive approach was used to model the relation, as described by Bland (mean of regression shown with dashed line). One point was found to be outside the ±1.96 S.D. limits of agreement (solid lines).
