
Figure 3.
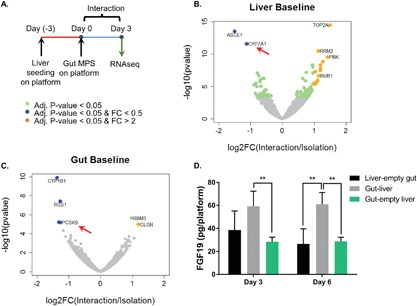
(A) Overview of experimental design. (B) Volcano plot illustrates the differentially expressed genes in the liver under baseline interaction versus isolation. Select biological processes up‐ and down‐regulated based on the differentially expressed gene (Adj. P‐values < 0.05) in 3B are displayed in Tables I and II. (C) Volcano plot illustrates the differentially expressed genes in the gut under baseline interaction versus isolation. Data point in green indicate statistically differentially expressed genes (FDR‐adj. P‐values < 0.05). Points in orange indicate significantly upregulated genes with effect size greater than twofold. Points in blue indicate significantly down‐regulated genes effect size greater than twofold. (D) FGF19 secretion was measured using ELISA. **P ≤ 0.01 denote statistical significance after Holm‐Sidak multiple‐comparison correction. N = 4, mean ± SD.