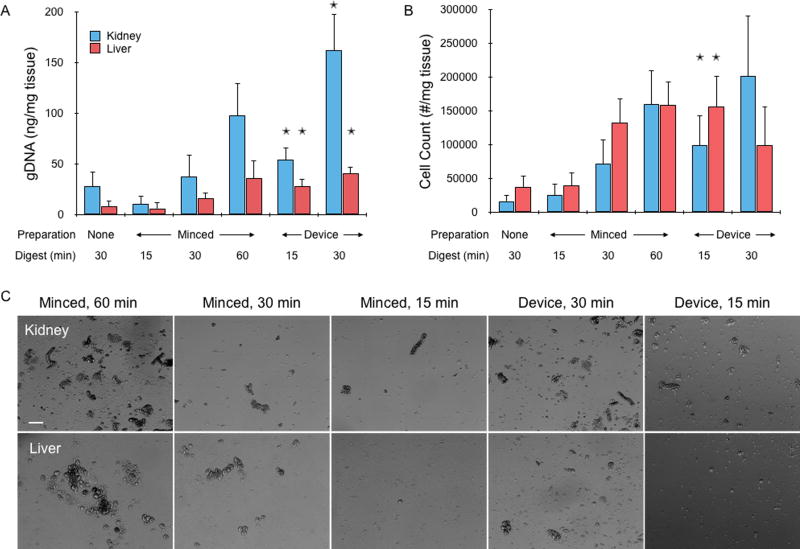
Figure 3.
Cell recovery from fresh mouse kidney and liver tissues. (A) Genomic DNA (gDNA) was extracted and quantified from cell suspensions obtained by digestion only, scalpel mincing and digestion, or device treatment lasting for a total of 15, 30, or 60 min. gDNA increased with treatment time, and overall was higher for kidney samples. Device treatment consistently provided more gDNA than minced controls at the same time point. In most cases, gDNA was also higher than the next digestion time point, although differences were not significant. (B) Cell counter results, showing that single cell numbers largely matched gDNA findings but with higher variability. Also, liver values were now similar comparable to kidney, suggesting that kidney suspensions may have contained more aggregates. (C) Micrographs of minced controls and device effluents after lysing red blood cells. Note the large number of aggregates in the controls, particularly at 60 min. Scale bar is 100 µm. Error bars represent standard errors from at least three independent experiments. * indicates p < 0.05 relative to minced control at the same digestion time.

