Figure 4.
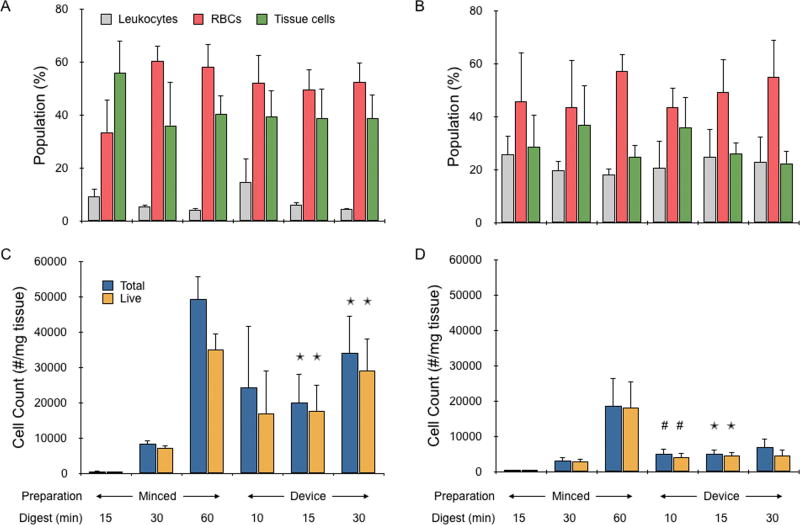
Single cell analysis of mouse kidney and liver cell suspensions. Flow cytometry was used to identify and quantify the number of leukocytes, red blood cells, and single tissue cells in the suspensions obtained from minced controls or device treatment. (A,B) Relative numbers of each cell type are shown for (A) kidney and (B) liver samples. Red blood cells comprised the highest percentage of almost all populations, and there was no statistically significant change in population compositions across all minced control and device conditions. (C,D) Total and live tissue cell numbers per mg of tissue were determined for (C) kidney and (D) liver samples. Tissue cell recovery increased with digestion time for minced controls, but did not change significantly with device processing beyond 10 min. Importantly though, all device conditions yielded more cells than minced controls that were digested for up to 30 min. Viability remained >80% for all but the longest time points, which reached as low as 70%. The x-axis for (A) and (B) are the same as (C) and (D). Error bars represent standard errors from at least three independent experiments. * indicates p < 0.05 relative to minced control at the same digestion time. # indicates p < 0.05 compared to minced control digested for 15 min.

