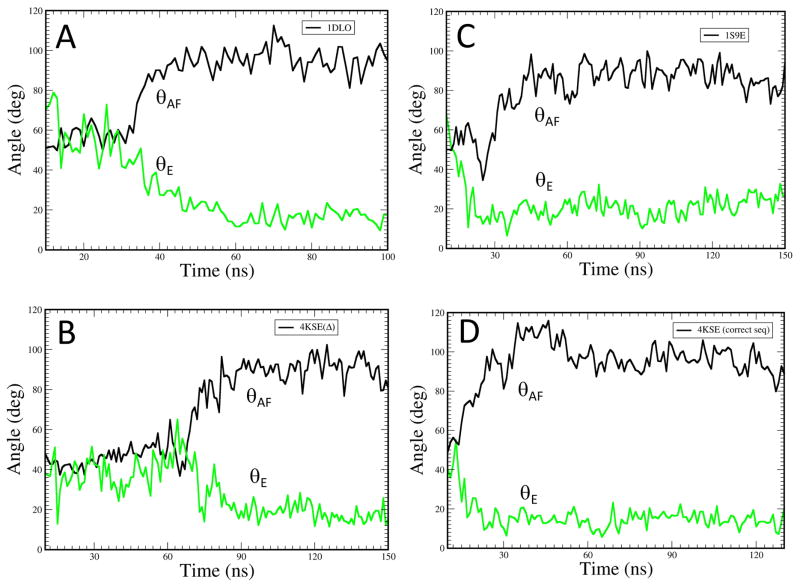
Figure 5. Molecular dynamics simulations of helix E.
Time-dependent behavior of θAF (black curve) corresponding to the angle between helices A and F, and θE (green curve) describing the bend in helix E, for the fingers/palm domains from molecular dynamics simulations starting with the following constructs: A) residues 1-236 of the p51 subunit of 1DLO with the segment from 219-230 modeled into the structure as described in Methods; B) residues 1-256 of the p51subunit of the p51ΔPL monomer (pdb: 4KSE); C) residues 1-236 of the p51 subunit of structure 1S9E that includes residues 219-230; D) residues 1-236 of the p51ΔPL monomer with the deleted 219-230 residue segment added to the initial model as described in Methods.

