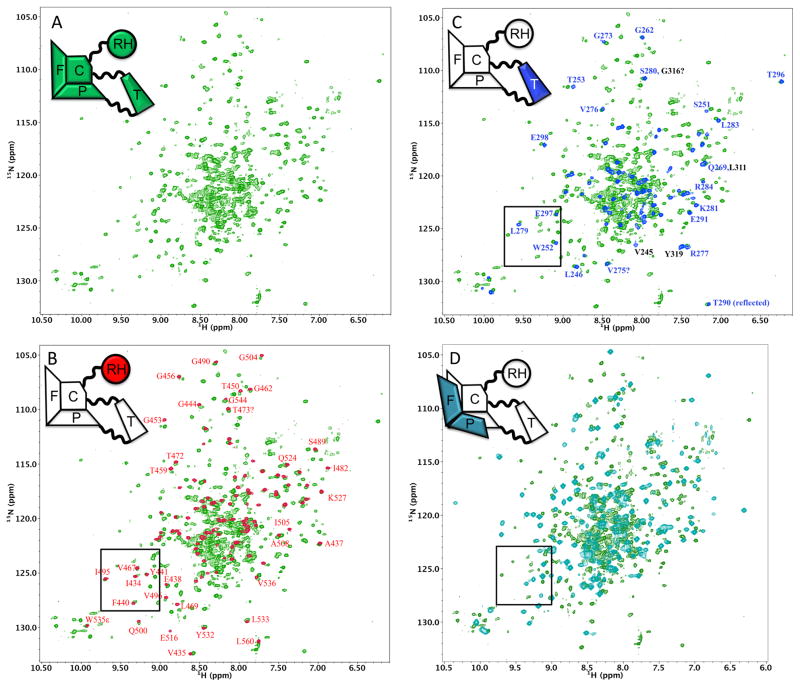
Figure 6. NMR spectra of the p66ΔPL monomer.
A) 1H-15N TROSY spectrum of U[2H,15N]p66ΔPL. B) Overlay of the 1H-15N HSQC spectrum of U-[15N]RH domain (red) with the spectrum in panel A (green). C) Overlay of the 1H-15N HSQC spectrum of U-[15N]thumb domain (blue) with the spectrum in panel A (green). D) Overlay of the 1H-15N TROSY spectrum of U-[2H,13C,15N]RT216 (cyan) with the spectrum in panel A (green). Since the data were obtained using somewhat different experimental conditions, labeling, and NMR experiments, the offsets in panels B and C were selected to optimize spectrum consistency. This was generally not feasible for the overlay in D, since optimization of some regions resulted in much poorer agreement in others. The box shown in the spectra corresponds to the spectral region highlighted by Sharaf et al. [20].

